


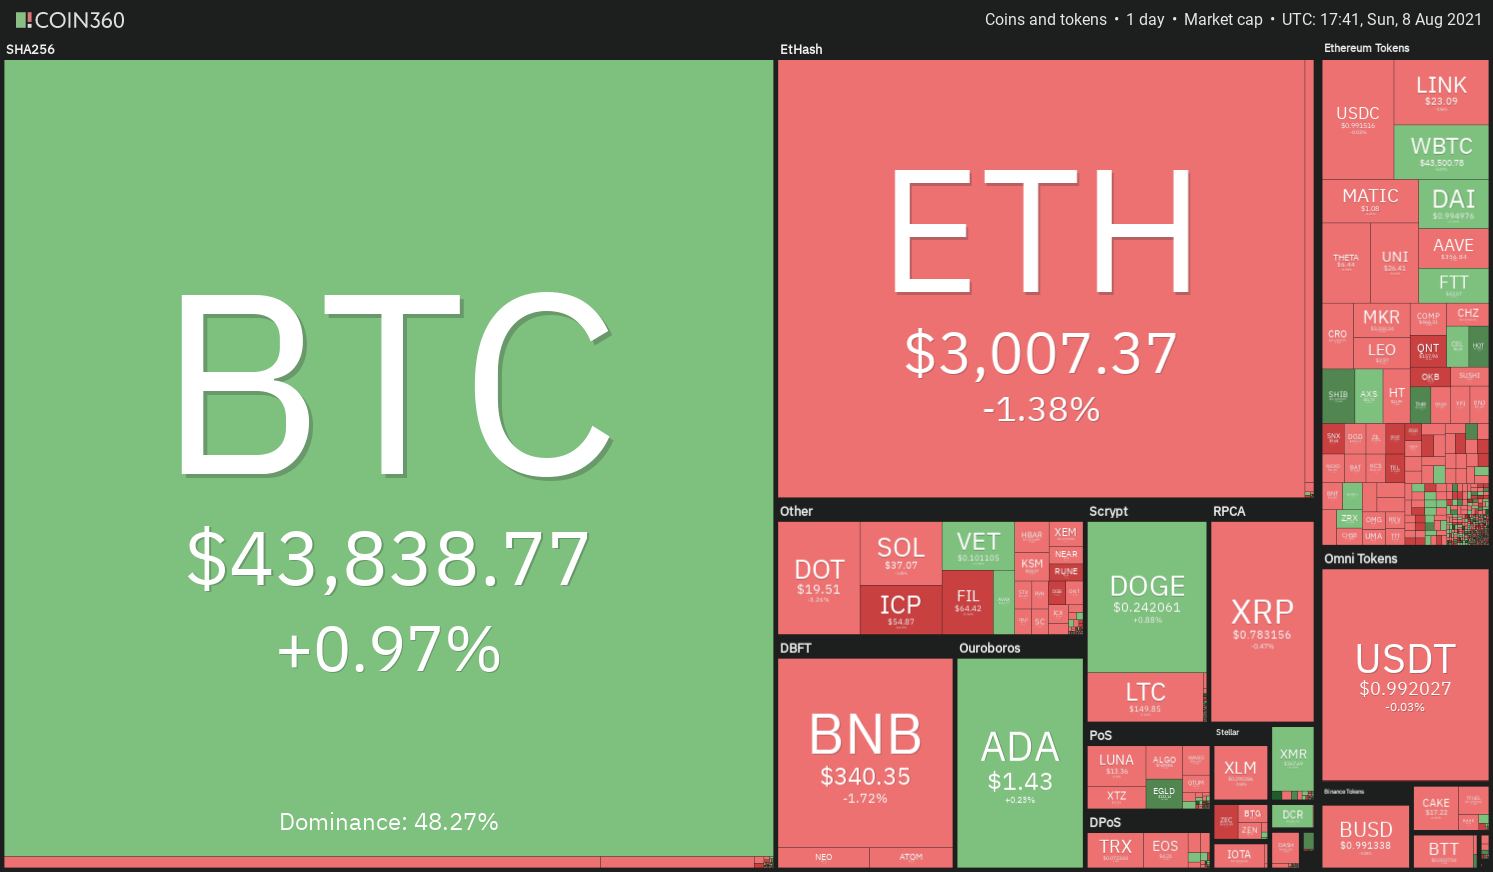
Bitcoin’s (BTC) rally above $45,000 suggests that the short-term sentiment has turned positive and this has increased buying interest across the board and pushed the total crypto market capitalization above $1.8 trillion.
Driven by the tailwind of the London hard fork, Ether (ETH) broke above the $3,000 mark on Aug. 7. While the rally in the biggest altcoin is a positive sign, on-chain data shows the possibility of profit-booking in the short term.


Glassnode’s “Ethereum: Percent of Addresses in Profits” indicator has risen above 96.4%, which is the “red zone, historically associated with local tops,” according to Lex Moskovski, the chief investment officer at Moskovski Capital.

While the near-term price action may remain volatile, the long-term picture looks positive. Reports suggest that venture capital (VC) funds have invested $17 billion into blockchain firms in the first half of the year. This amount is almost equal to the total investments made by VC funds in all the previous years combined, which shows the bullish outlook for the future.
Buyers will now attempt to hold on to their advantage and build upon it. Let’s study the charts of the top-5 cryptocurrencies that may outperform in the short term.
BTC/USDT
Bitcoin broke above the resistance of the range at $42,451.67 on Aug. 6, which suggests that bulls are attempting to start a new uptrend. The buyers are likely to face stiff resistance at the 200-day simple moving average ($44,879).

If the price turns down from the 200-day SMA but does not break below the breakout level of $42,451.67, it will suggest that the sentiment has changed from sell on rallies to buy on dips. That will increase the possibility of a breakout of the 200-day SMA.
If that happens, the BTC/USDT pair could rally to the $50,000 to $51,483 overhead resistance zone. This level may again act as a stiff resistance but if the bulls arrest the subsequent decline above the 200-day SMA, the uptrend could continue.
The upsloping 20-day exponential moving average ($39,230) and the relative strength index (RSI) near the overbought zone suggest that bulls are in control.
This positive view will be negated if the bears sink the price below the 20-day EMA. That could pull the price down to $36,670.

The 4-hour chart shows that the bears are attempting to pull the price back below the breakout level at $42,451.67. However, the rising 20-EMA and the RSI in the positive territory suggest that bulls are in command.
If the price rebounds off the 20-EMA, the pair could continue the uptrend towards $50,000. Alternatively, a break and close below the breakout level at $42,451.67 will be the first sign that the buyers may be losing their grip. That could open up the possibility for a fall to $40,000.
LTC/USDT
Litecoin (LTC) broke and closed above the $146.54 resistance on Aug. 6, completing a double bottom pattern. If bulls sustain the price above the breakout level, it will suggest the start of a new uptrend.

The RSI is in the positive zone and the 20-day EMA ($140) has been moving up gradually, indicating that bulls are at an advantage. If the price turns up from the current level or the 20-day EMA, the LTC/USDT pair could rally to the pattern target at $189.25, which is just below the 200-day SMA ($190).
Contrary to this assumption, if bears pull the price back below the 20-day EMA, it will suggest that the current breakout was a bull trap. The pair could then drop to $120 and then to the critical support at $103.83.

The 4-hour chart shows that the bulls pushed the price above the stiff overhead resistance at $150 but are struggling to sustain the higher levels. The bears are attempting to pull the price back below the breakout level.
If they manage to do that, the pair could slide to $135. Conversely, if the price rebounds off the current level, the bulls will attempt to resume the uptrend. The next target objective on the upside is $165 and then $180.
ICP/USDT
Internet Computer (ICP) is attempting to form a reversal pattern. The bulls pushed the price above the overhead resistance at $59.42 on Aug. 7, which completed a double bottom pattern.

However, the bears have other plans and they have pulled the price back below $59.42. The ICP/USDT pair could now drop to the 20-day EMA ($43). A break below this support will suggest that the pair could remain range-bound for a few more days.
On the other hand, if the price turns up from the current level or the 20-day EMA, the bulls will again try to propel the price above $59.42. If they can pull it off, the pair could start a new uptrend, which has a pattern target at $90.53.

The 20-EMA on the 4-hour chart has turned up and the RSI is in the positive zone, indicating that buyers are making a comeback. If the price rebounds off the 20-EMA, the bulls will try to resume the up-move.
The bears are likely to mount a stiff resistance in the $66 to $72.27 zone but if the bulls can thrust the price above it, the uptrend could pick up momentum. The first sign of weakness will be a break below the 20-EMA. That could open the doors for a decline to $50.
THETA/USDT
THETA broke above the downtrend line on Aug. 4, suggesting that the selling pressure may be reducing. The price reached the 200-day SMA ($7.24) on Aug. 5 where the bears are offering stiff resistance.

The THETA/USDT pair formed a Doji candlestick pattern on Aug. 7, indicating indecision among the bulls and the bears. This uncertainty resolved to the downside today. The pair could now drop to the 20-day EMA ($6.07)
If the price rebounds off the 20-day EMA, the bulls will make one more attempt to clear the overhead hurdle at the 200-day SMA. If they succeed, the pair could start its journey toward the next target objective at $10.
On the contrary, if bears pull the price below the 20-day EMA, the pair could slide to $5.28. A break below this support will suggest that the current rally was a dead cat bounce.

The bears are attempting to stall the relief rally near the overhead resistance at $7.50. They have pulled the price below the 20-EMA and will now try to break the support at $6.30. If they manage to do that, the pair could drop to the 200-SMA.
Conversely, if the price rebounds off $6.30, it will suggest that bulls continue to buy on dips. The buyers will then try to push and sustain the price above $7.50. If they succeed, the pair could start its journey toward $9.
FTT/USD
FTX Token (FTT) has made a strong recovery since breaking out of the 200-day SMA ($34.60). The bears tried to pull the price back below the 200-day SMA on Aug. 4 but failed, which shows a change in sentiment from bearish to bullish.

The sharp rally of the past few days has pushed the RSI into the overbought territory, which suggests a minor consolidation or correction in the near term. When the sentiment is positive, traders buy the dips to the 20-day EMA ($35.81).
If the price rebounds off this support, the bulls will again try to resume the up-move and push the FTT/USDT pair to the psychological resistance at $50. This positive view will invalidate if the price drops and closes below the 200-day SMA.

The 4-hour chart shows the pair picked up momentum after the bulls pushed the price above the overhead resistance at $37. The pair has been finding support at the 20-EMA during corrections, indicating that the sentiment is to buy the dips.
If the price dips but bounces off the 20-EMA, it will suggest that the uptrend remains intact. The pair could then charge toward the overhead resistance at $50 and then $52. The bears will have to pull and retain the price below the 20-EMA to start a correction that could reach $37.
The views and opinions expressed here are solely those of the author and do not necessarily reflect the views of CoinNewsDaily. Every investment and trading move involves risk, you should conduct your own research when making a decision.


