


A bull trend is formed when there is more demand than there is supply, and a bear trend is formed when sellers outnumber buyers.
There is a trading range when the bulls and bears don’t move from where they are.
As a result, sometimes there is an area that looks like a rectangle. This is also known as “consolidation” or “congestion.”
It is usually thought that bearish and bullish rectangles are continuation patterns, but on many occasions, they are used to signal the end of a major top or bottom.


Before we learn more about the bullish and bearish rectangle patterns, let’s talk about how to tell them apart.
Basics of the rectangle pattern
Rectangles happen when a piece of an asset has at least three top points and two bottom points that are almost at the same level.
To make the rectangle’s resistance and support lines, you can connect the high and low points by drawing two lines that are both parallel to each other.
Depending on how long the rectangle lasts, it could last from a few weeks to several months. If the rectangle lasts less than three weeks, it is called a flag.
Most of the time, the longer an asset is in consolidation, the bigger the breakout or break from it will be.
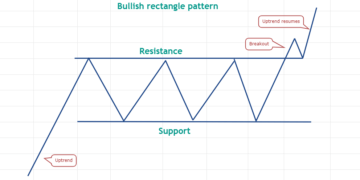
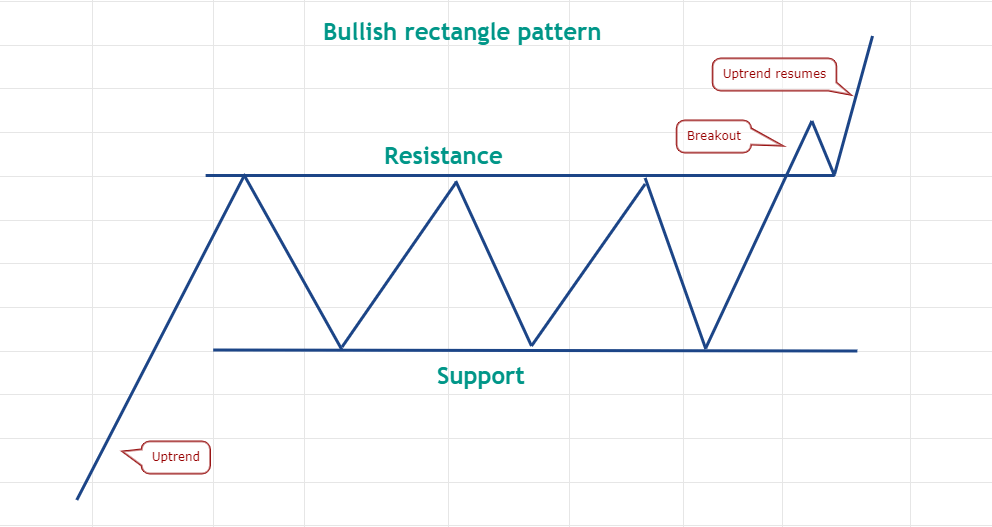
Bullish rectangle pattern

During the uptrend shown above, some bulls took profits and this led to the first reaction high. The asset is now in an uptrend again.
After the price starts to go down, a lot of people who are willing to buy at the bottom of the market stop it. This is the first trough.
A rise in demand pushes an asset to try to keep going up. When the price reaches its previous reaction high, traders again take profits.
Putting two high points together with a straight line makes the rectangle more durable.
When the price goes down, buyers try to keep the price from going down even more. This makes the support.
Before the breakout, it’s hard to know which way the price will go. The price could be stuck between the support and the resistance for a few weeks or even months.
Wait until the price breaks out of the rectangle before you make a move.
People are willing to pay more for a stock than they can get, so the price breaks out of the range’s resistance.
This could cause the uptrend to start again.
Bearish rectangle pattern

An example of this can be seen above. When the price reaches a level that traders think is undervalued, dip buyers take in the supply and make a low in response.
The bulls then try to change direction, but the mood is still sour and traders sell on rallies, forming the reaction high.
A drop in price is another opportunity for traders to buy. When prices reach their first reaction low, they buy again. But when prices reach their first reaction high, they stall the recovery near that point.
After that, the price gets stuck between the lines, forming a rectangle.
When the price breaks and closes below the support of the range, the bearish rectangle pattern is over, and it’s called a rectangle.
This usually leads to the start of the downtrend again.
A bullish continuation rectangle pattern

The price of THETA had been going up before it hit a resistance point near $0.80 on Sep. 30, 2020.
On the down side, buyers came in and stopped the correction at $0.55.
After that, the price stayed between these two levels until December 15, 2020.
On December 16, 2020, the THETA/USDT pair broke above the rectangle. This meant that the bulls had pushed the bears back.
This meant that the uptrend was going to start again.

To figure out the goal of the breakout from the rectangle pattern, figure out the height of the rectangle.
Height: $0.25 in this case.
To get the breakout level, add this value to it. It’s $0.80 in this example, but you can change it to something else.
That puts the goal price at $1.05.
After a long pause, when the uptrend starts again, it may not hit the target as well as it did above.
Trader’s can use their target to help them decide whether to close or keep their trade, but they should think about how strong the trend is and what other indicators are telling them.
The same steps apply to bearish rectangles as shown in the picture below.
 LTC/USDT daily chart. Source: TradingView
When Litecoin (LTC) went from $184.98 on May 6 to $73.22 on June 24, 2018, it went down a lot.
They tried to make a bottom at this point, but the bears were not going to let them.
We were at $90 on July 3, 2018. They stopped the recovery then.
After that, the LTC/USDT pair stayed between these two levels until Aug. 6, 2018.
It was Aug. 7, 2018. The bears took back control and pulled the price down below the rectangle, so it fell.
This started the trend down again.

Deducting the height of a bearish rectangle from the point where it broke down is used to figure out the target goal after the rectangle breaks down.
Above, the rectangle is $17 high, so its height is also $17.
Deducting it from the breakdown level at $73 gives us a goal of $56.
The rectangle as a reversal pattern

When the price of Ether (ETH) hit $1,440 in January 2018, it started to fall very quickly. It hit $81.79 in December 2018.
There were a lot of people who bought the ETH/USDT pair when the price hit this level.
Bears, on the other hand, slowed down the recovery when the price reached $300 in June 2019.
After that, they were stuck between these two levels until July 24, 2020.
A new uptrend was likely to start on July 25, 2020, when the price pushed above the rectangle, which is when the bulls took over.
At first, the bears tried to get prices to go back below the level at $300, but they couldn’t.
This showed that traders were buying the dips because they thought the market was going to go up.
In November 2020, the pair started going up again.
It didn’t reach its target of $518.21, but the pair hit an all-time high of $4,372.72 in May.
Key takeaways
Rectangles can be used to make new patterns and to make old patterns go backward.
In a rectangle that is big, traders can buy and sell near the support and support lines.
To get the most out of the rectangle and avoid getting whipsawed, traders can wait for the price to break and stay above or below the pattern before setting up trades.
It’s best to only use the target goal as a guide because when the price breaks out of a long rectangle, it tends to go way over the target goal.
The author’s thoughts and opinions are entirely his or her own and do not necessarily reflect those of CoinNewsDaily. Each investing and trading action entails risk; before making a decision, you should conduct your own research.


