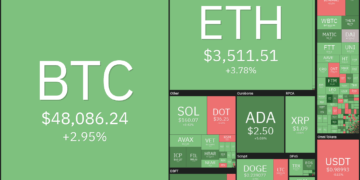


BTC (bitcoin) is the cryptocurrency that is driving the recovery in the crypto sector, and the cryptocurrency temporarily surged to $48,429 on Sept. 15 before retracing its steps to test underlying resistance levels.
At the SALT conference in Salt Lake City, Ark Invest CEO Cathie Wood stated Bitcoin is the default currency of the cryptocurrency world and that it may increase tenfold in the next five years. She was speaking via live broadcast.


Among the assumptions she makes is that Bitcoin will find a home on the balance sheets of many corporations and that institutional investors would boost their allocation to Bitcoin and other cryptocurrencies to approximately 5 percent of their portfolios.
As the demand for digital assets continues to rise, several legacy financial institutions have recognized the need to expand their crypto products in order to meet that need. Morgan Stanley has recently established a new crypto-focused research branch, „in acknowledgment of the growing relevance of cryptocurrencies and other digital assets in global markets,“ according to the company.

Additional encouraging news came from Fidelity Investments executives, who met with a number of authorities from the United States Securities and Exchange Commission and emphasized the importance of why a Bitcoin exchange-traded fund should be permitted, according to reports. It was mentioned that bitcoin usage is increasing, that comparable funds have been approved in other countries, and that there is a growing desire for digital assets among those in authority.
Is it possible for Bitcoin and other cryptocurrencies to maintain their current gains? Check at the top 10 cryptocurrencies‘ charts to see what we can learn from them.
BTC/USDT
The lengthy tail on the candlestick on September 13 indicates that bulls were aggressively buying on dips towards the important support level of $42,451.67.
As a result of sustained buying by the bulls and the possibility of bears covering their positions, Bitcoin rose over the 20-day exponential moving average (EMA) ($47,195), which was reached on Sept. 15.

BTC/USDT might reach the $50,500 to $52,920 overhead resistance zone if bulls are able to keep the price above the 20-day exponential moving average (EMA).
The relative strength index (RSI) has returned to positive territory, and the 20-day exponential moving average (EMA) has flattened down, indicating a slight edge for buyers. The return of the uptrend will be signaled by a breakout and closing above the overhead resistance zone.
Bears, on the other hand, are unlikely to give up their fight so lightly. When they reach the overhead zone, they will seek to stall the upward movement. If the price reverses from the resistance level, the pair may settle in a wide range for a few more days before reversing.
Bears must bring down the price of Bitcoin to and keep it below $42,451.67 in order to gain the upper hand.
ETH/USDT
The extended tail on the candlestick that formed on September 13 indicates that bulls are defending the 50-day simple moving average ($3,189) with vigor.
On September 15, buyers propelled Ether (ETH) above the 20-day exponential moving average ($3,430), but the cryptocurrency may meet severe resistance at $3,567.06.

If bulls are able to clear the overhead resistance, the ETH/USDT pair could make another effort to reach $4,000. Alternatively, if the price declines from $3,567.06, the pair may fall to the 50-day simple moving average (SMA).
Such a move will imply that the pair will remain range-bound for a few days at the very least. The 20-day exponential moving average is flat, and the RSI is barely above the midway, indicating a minor advantage for buyers.
In order to herald the beginning of a likely down trend, the bears will have to dive and maintain the price below important support at $3,000 for an extended period of time.
ADA/USDT
Cardano (ADA) fell below the breakout level of $2.47 on September 13, but the bears were unable to push the market below the 50-day simple moving average ($2.21). This shows that selling becomes ineffective at lower price levels.

Bulls and bears were equally uncertain about their positions on September 14, as seen by the formation of a Doji candlestick pattern in the ADA/USDT pair. As of the time of writing, buyers are attempting to clear the resistance level around $2.55, which corresponds to the 20-day exponential moving average (which was resolved to the upside on September 15).
If the price breaks and closes above the 20-day moving average, it is possible that the price could rise to the overhead resistance zone between $2.97 and $3.10. (EMA).
Alternatively, if the price of the pair continues to decrease from the 20-day exponential moving average, the bears will aim to drive the pair down below the 50-day simple moving average, according to the chart below. A break and a close below this support level will indicate the probability of a reversal in the current trend.
BNB/USDT
Because the bears were unable to take advantage of the break and close below the 50-day simple moving average ($414) on September 13, it is prudent to buy at lower prices. Binance Coin (BNB) is currently trading above the 20-day exponential moving average ($436), which the bulls are attempting to surpass.

If bulls are able to keep the price above the 20-day exponential moving average, it will signal that the correction may be nearing an end. The BNB/USDT pair might potentially rise up to the overhead resistance level of $518.90, which represents a significant upward advance. The resumption of the uptrend will be signaled by a break and closing above this resistance level.
Bears are selling on relief rallies, as evidenced by the price turning down from the 20-day exponential moving average (EMA). After that, the bears will make one more try to drive the pair down to the next support level at $340.
XRP/USDT
On September 13, Ripple (XRP) rallied off the 50-day simple moving average ($1.05), indicating that bulls are defending this level. The altcoin might potentially ascend to the 20-day exponential moving average ($1.13), where the bears are expected to mount a strong resistance.

The 20-day exponential moving average is progressively trending downward, and the relative strength index (RSI) is barely below the midway, indicating a little advantage for the bears. A break and closure below the 50-day simple moving average (SMA) will indicate that the bears have gained the upper hand over the bulls. If bears are successful in driving the stock below the $0.95 intraday low set on September 7th, the selling could get more intense.
Bulls driving and maintaining the price above the 20-day exponential moving average (EMA) will imply that the correction may be nearing its conclusion. The XRP/USDT pair might then ascend to the overhead resistance zone of $1.35 to $1.41, which would represent a significant gain.
SOL/USDT
In Solana’s (SOL) Sept. 13–14 candlestick, the long tail indicates that bulls are making an attempt to defend the 20-day exponential moving average ($145), while the negative sign indicates that bears are not allowing the comeback to continue.

The inside-day candlestick pattern that formed on September 15 suggests that both bulls and bears are undecided. As long as the uncertainty persists on a downward trajectory and the SOL/USDT pair remains below the 20-day moving average, a decline might extend all the way to the 61.8 percent Fibonacci retracement level at $123.42.
The greater the depth of the correction, the longer it is likely to take for the next leg of the uptrend to get underway. As an alternative, if prices continue to rise and surpass $171.83, the pair could advance to $197.41 before retesting the all-time high of $216.
DOT/USDT
However, the bulls have been unable to clear the obstacle at the resistance line, which has forced Polkadot (DOT) to continue its northward march.
The RSI has deviated downward from the downtrend line, and the negative divergence is still present.

The DOT/USDT pair may gain momentum if buyers push the price over the resistance line and close the trade above the line of resistance. It is possible that the pair could rally to $41.40, and if this level is crossed, the pair will head towards its all-time high of $49.78.
Alternatively, if the price declines from its current level, the pair may fall to the 20-day exponential moving average ($31.45). An immediate and significant bounce off this support level will indicate that bulls are aggressively buying on dips. The likelihood of a break over the resistance line will increase as a result.
The first clue that bears are making a significant comeback will be a break and closure below the 20-day exponential moving average.
DOGE/USDT
Dogecoin (DOGE) is trapped between the moving averages and the support level at $0.21, which is a technical support level. Despite the fact that bulls are attempting to defend the $0.21 support level, the bounce is lacking in force. This shows that present levels of demand are weak.

A bearish crossover between moving averages is about to be completed, and the Relative Strength Index (RSI) continues to trend downward, suggesting that the path of least resistance is to the lower.
If bears are able to push the price below $0.21, the DOGE/USDT pair might plunge to the next key support level at $0.15, according to market analysts.
In contrast, a break and close above the moving averages will be the first indication that bulls have returned to the game. The pair has the potential to gain momentum above the downtrend line.
UNI/USDT
In the past several days, the bears have been unsuccessful in their attempts to drag Uniswap (UNI) below its intraday low of $21 set on September 7. This demonstrates that people are buying at reduced prices. The bulls were able to push the price above $25 on September 14, but they are encountering severe resistance at the moving averages at this time.

It is possible that the UNI/USDT pair may drop to $23.45 and then $21 if the price continues to decline and falls below $25. In particular, a break below this level indicates the possibility of a more significant correction.
If, on the other hand, the price rises off of $25 or from $23.45, this will indicate that bulls are attempting a comeback in the market. Any move above the moving averages, as well as a close above them, could open the door to a probable gain to $31.41.
LUNA/USDT
The LUNA token of the Terra protocol bounced off the 20-day exponential moving average ($33.50) on September 13, as evidenced by the extended tail on the day’s candlestick. This shows that investors‘ attitude is still optimistic and that traders are buying on dips in the market.

On September 14, the LUNA/USDT pair developed an inner candlestick pattern, indicating that bulls and bears were unable to come to a decision. A break and closure below the 20-day exponential moving average (EMA) will imply an advantage for the bears. The pair may then correct to the 50-day simple moving average ($25.25).
In contrast, if bulls are able to push the price over $38, the pair may be able to resume its upward trajectory toward the all-time high of $45.01. If the pair manages to break and close above this resistance level, it may be able to move towards the psychological level of $50.
The views and opinions expressed here are solely those of the author and do not necessarily reflect the views of CoinNewsDaily. Every investment and trading move involves risk. You should conduct your own research when making a decision.
Market data is provided by HitBTC exchange.


