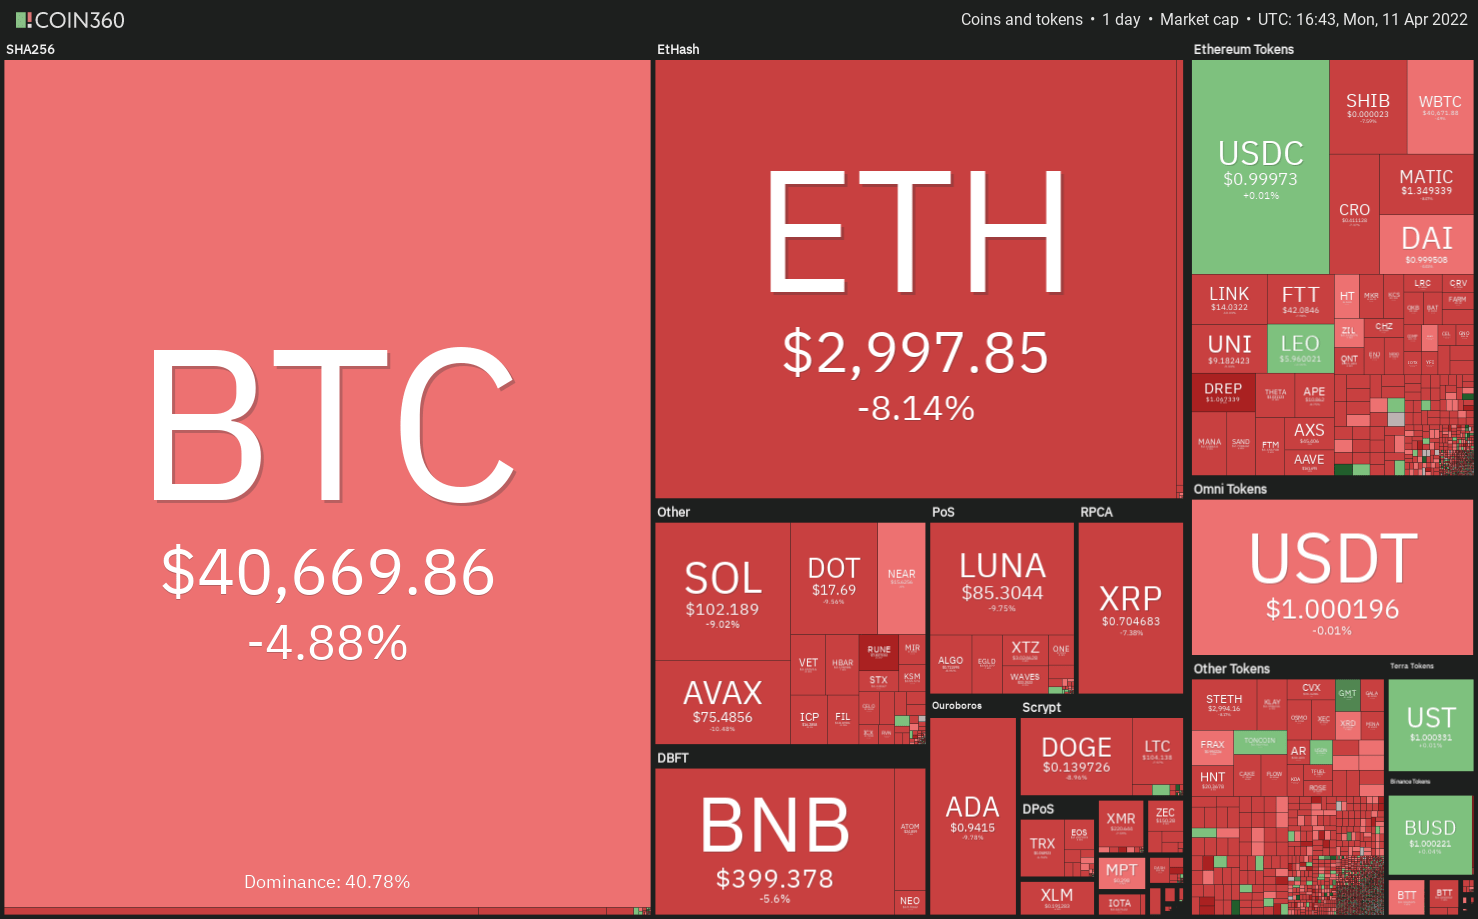
Bitcoin (BTC) and most of the major altcoins have broken through important support levels to start the week on a down note, which is not a good start.
They seem to be following the trend of the US equity markets, which are going down as investors move away from risky assets because of rising interest rates.
BitMEX CEO Arthur Hayes said that when interest rates rise and the Federal Reserve stops buying assets, the equities market could go into a tailspin and lose a lot of money.
That would make Hayes think that the crypto markets would keep going down. Bitcoin would fall to $30,000 and Ether (ETH) would fall to $2,500 by June this year, he says.
Ark Invest founder Cathie Wood told CNBC that decentralized finance apps are getting a lot of attention from investors.
The legacy banking industry is feeling the heat because not only are they losing business and talent to DeFi, but they are also losing people to the crypto industry, which is a new type of business.
Even though the long-term is still good, could Bitcoin and other cryptocurrencies weaken even more in the near term?
To find out, let’s look at the charts of the top 10 cryptocurrencies to see what they look like.
BTC/USDT
The bulls kept Bitcoin above the 50-day simple moving average (SMA) ($41,908) for a few days, but they couldn’t get the price to above the 20-day simple moving average (EMA) ($43,576).
This suggests that bears are selling when the market goes up.
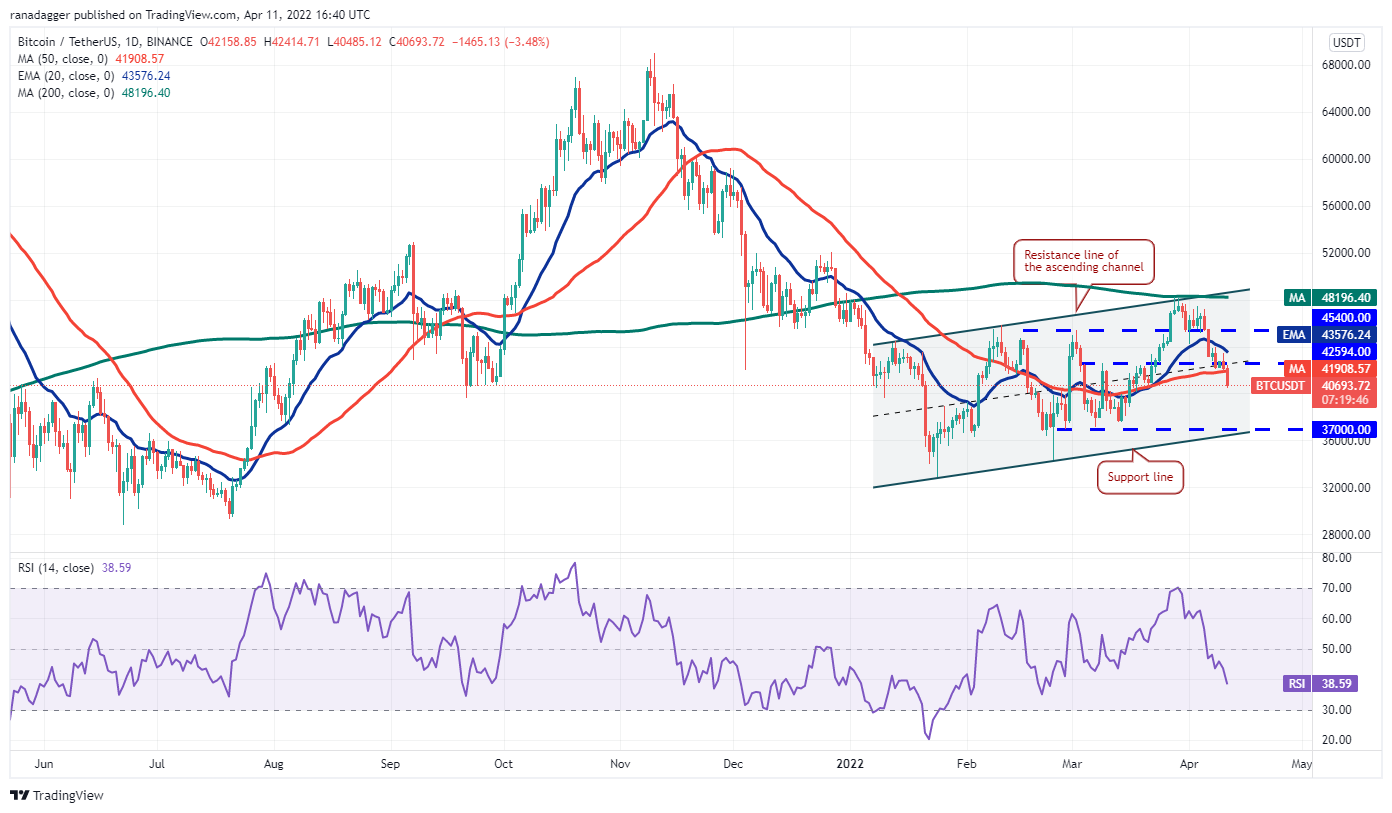
As of April 11, the price has dropped below the 50-day SMA.
At $40,000, there is some support. If it breaks, the BTC/USDT pair could fall to the support line of the ascending channel.
The bulls are likely to fight hard to keep this level.
The downslope of the 20-day EMA and the RSI in the negative zone show that the bears are back in charge.
Short-term, this negative view will be proven wrong when the price turns up and breaks above the 20-day EMA.
The pair could then rise to $45,400.
ETH/USDT
Ether has been near the 20-day EMA ($3,198) for the last few days, but the weak bounce off of it suggests that the bulls aren’t buying very quickly.
That may have made the bears more confident, which may have led them to sell more quickly today.
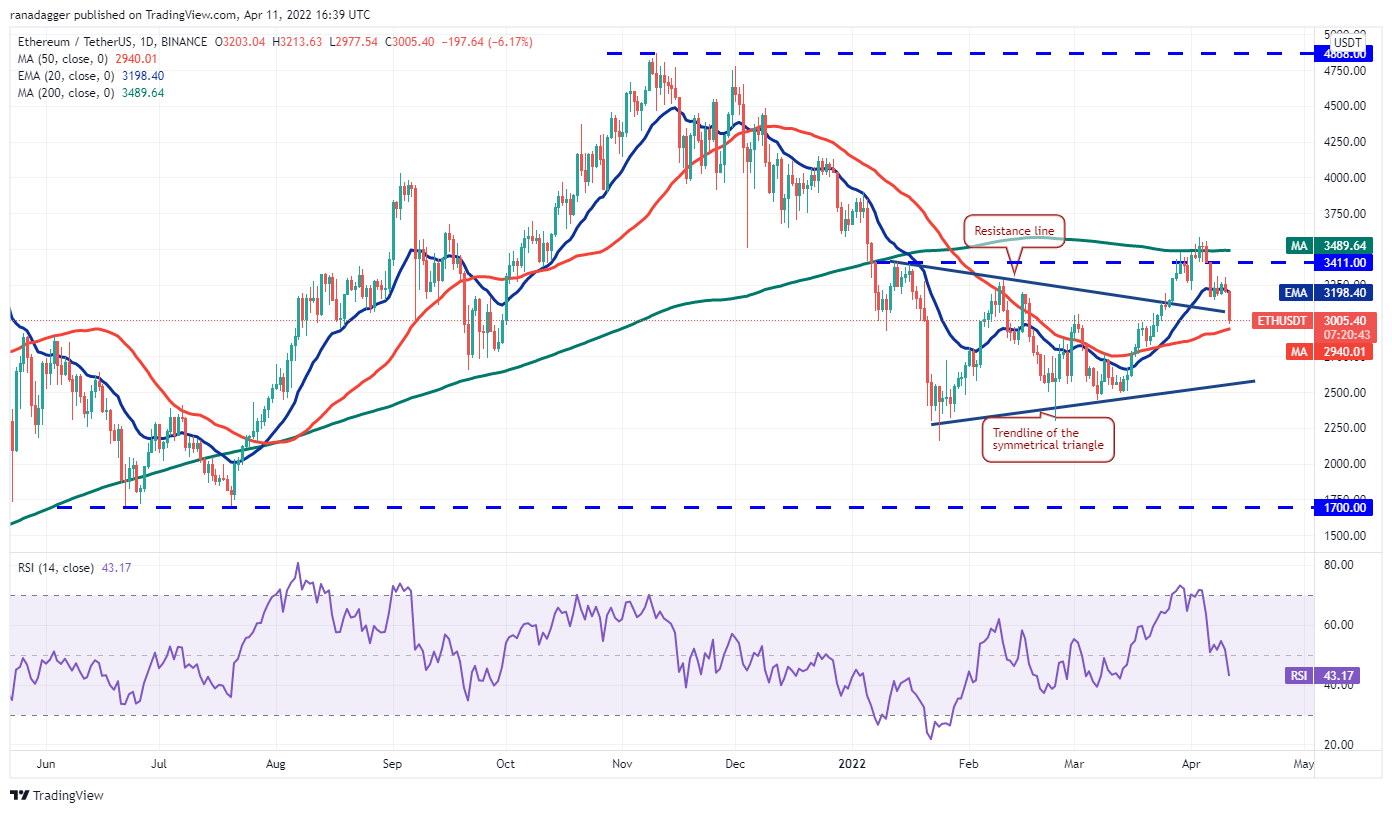
A new goal: The bears will now push the price down to the 50-day SMA ($2,940).
A few days could pass before the ETH/USDT pair moves above this support. If it does, the pair could be stuck between the 50-day SMA and the 200-day SMA ($3,489) for a while.
Because if the price breaks below the 50-day SMA, the selling could speed up and the pair could fall to $2,800. This is also possible.
A break below this support could lead to a fall to the trend line.
The bulls are expected to fight hard to keep this level safe.
BNB/USDT
April 8 was a bad day for BNB. It turned down from $445 and broke below its 20-day EMA ($422).
This means that bears are selling when the price rises to $445.
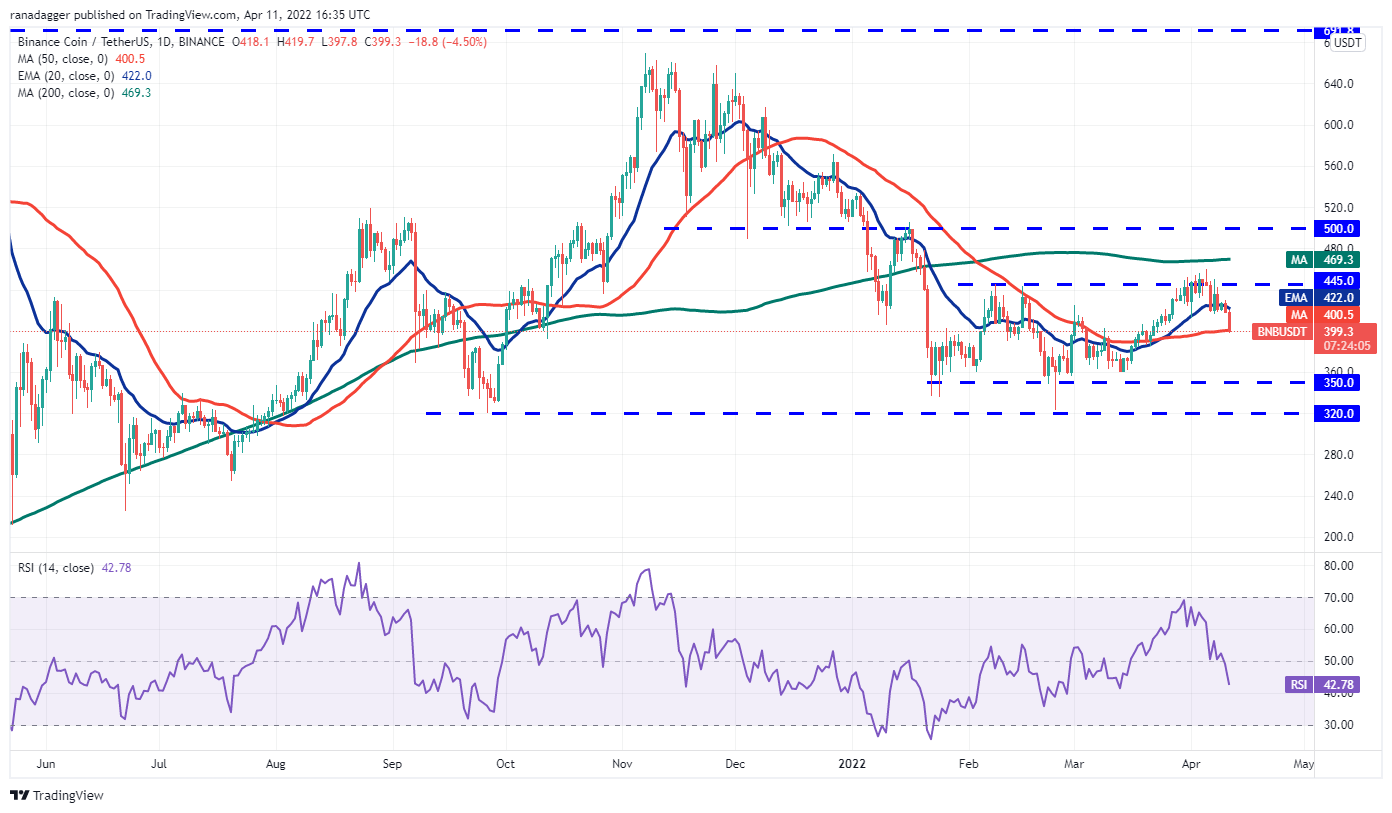
Buyers tried to push the price back above the 20-day EMA in the last two days, but they couldn’t keep it there.
This made people want to sell again, and the BNB/USDT pair has dropped to the 50-day SMA ($400).
A strong rise from the current level will show that bulls are buying when prices fall.
It will help if the price pushes and stays above the 20-day EMA. This will make it more likely that the price will go back down to $445.
However, if the price falls below the 50-day SMA, it will mean there isn’t any more money to be made in the market.
A lot of people think that would make it fall down to the strong support level at $350.
SOL/USDT
On April 8, Solana (SOL) fell below the 20-day EMA at $111.
The bulls pushed the price back above the 20-day EMA on April 10, but they couldn’t keep it there.
This suggests that bears are selling when the market goes up.
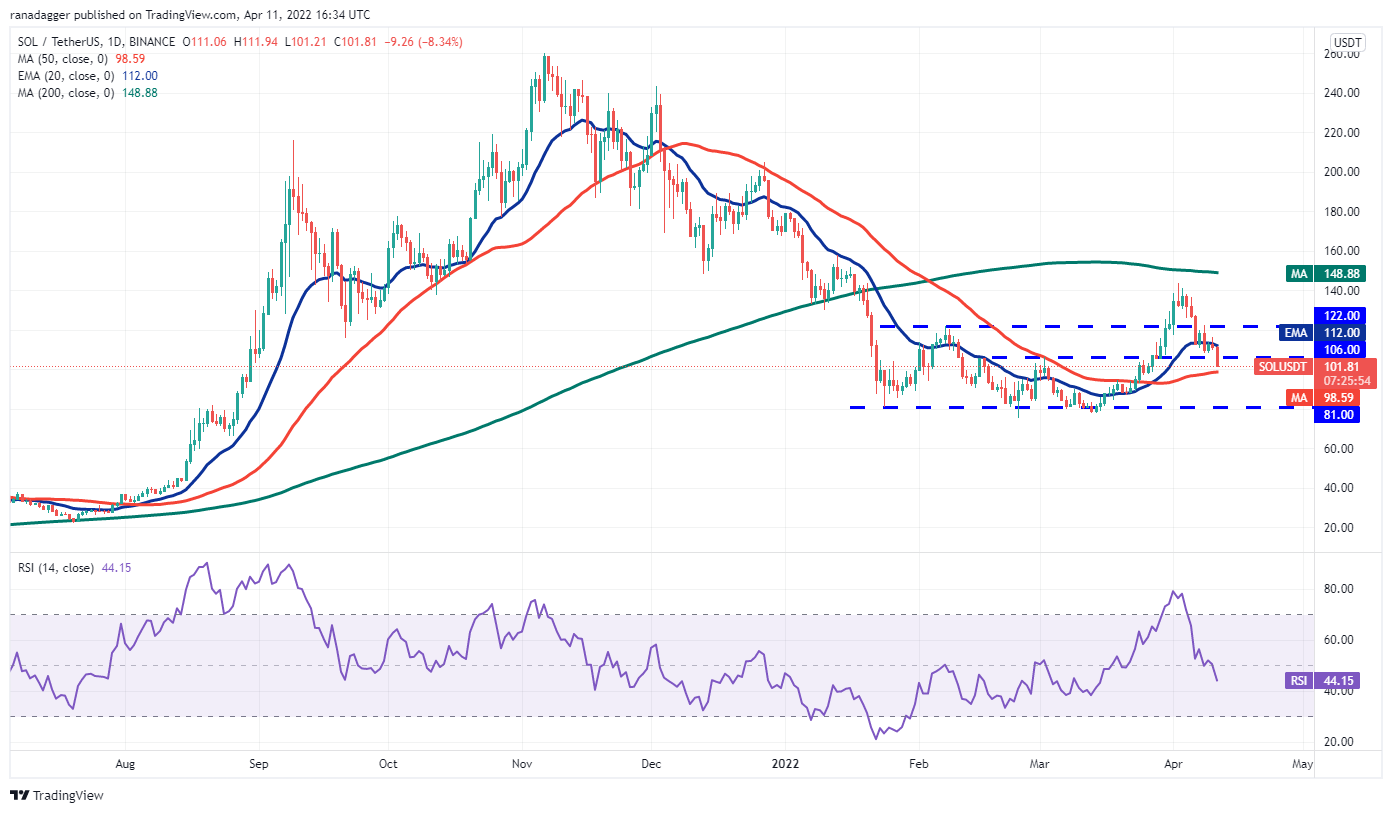
A lot of people started selling on April 11. The price has now dropped below $106.
This means that the SOL/USDT pair could now fall to the 50-day SMA ($98), which is likely to be a strong point of support.
If the price rises above the 50-day SMA and then breaks above the 20-day EMA, it will show that there is a lot of demand for things at a low price.
However, a break and close below the 50-day SMA could open the door to a drop to $81.
XRP/USDT
A few days ago, Ripple (XRP) traded above the $0.75 level, but the price didn’t move above the moving averages. This may have caused more selling by the bears.
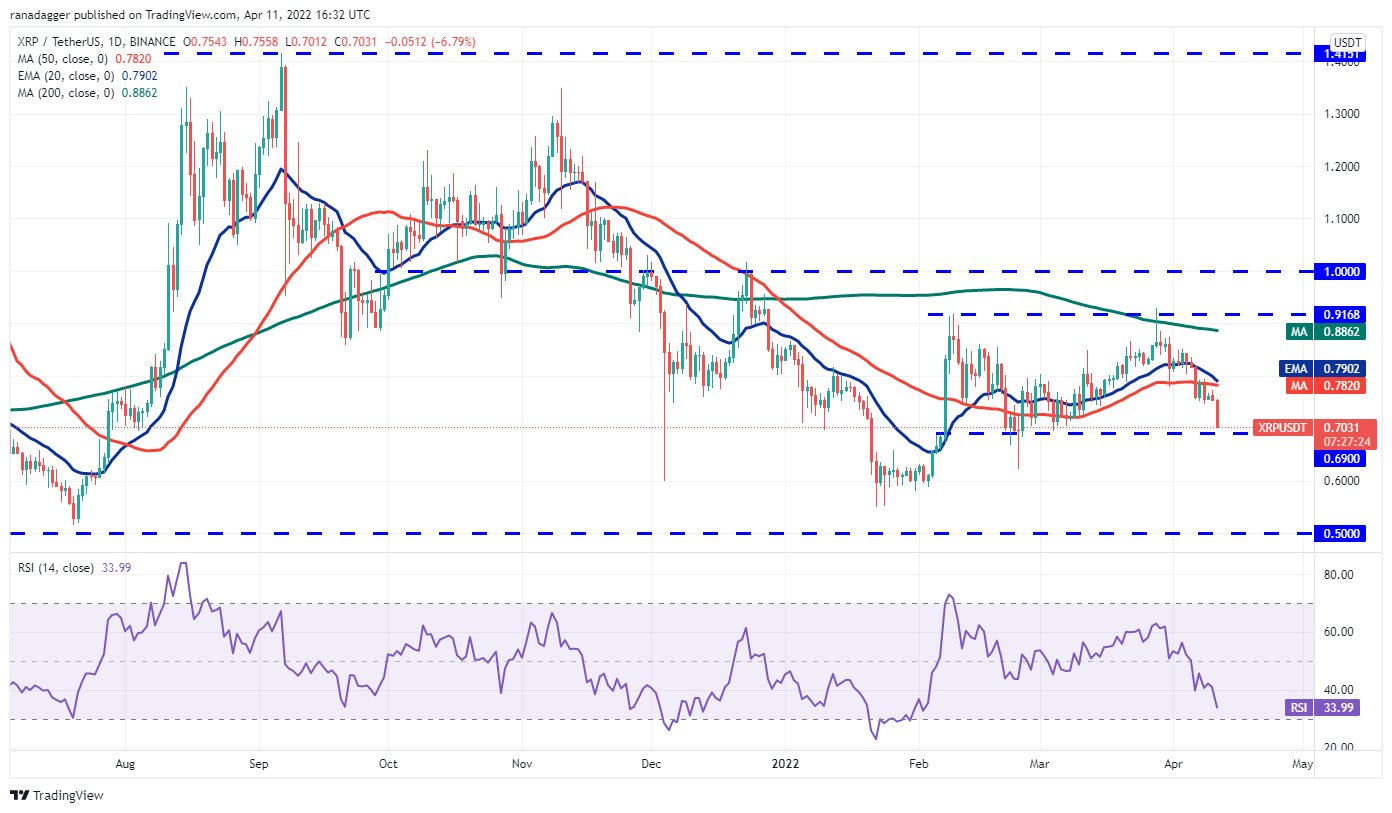
The 20-day EMA ($0.79) has turned down, and the RSI is near 34, which means that the sellers are in charge,
This is likely to be the next stop. It will be about $0.69.
A strong rebound from this level will show that bulls are fighting hard to keep this level.
That could keep the XRP/USDT pair stuck in a range between $0.69 and $0.91 for a while.
In other words, if the price drops below $0.69, the selling could get worse, and the pair could fall to the next major support at $0.60.
ADA/USDT
This week, Cardano (ADA) tried to get back above the 20-day EMA at $1.06. The bears didn’t let it happen, and the price didn’t go up.
On April 11, there was a lot of selling, and the price fell below the 50-day SMA ($0.96).
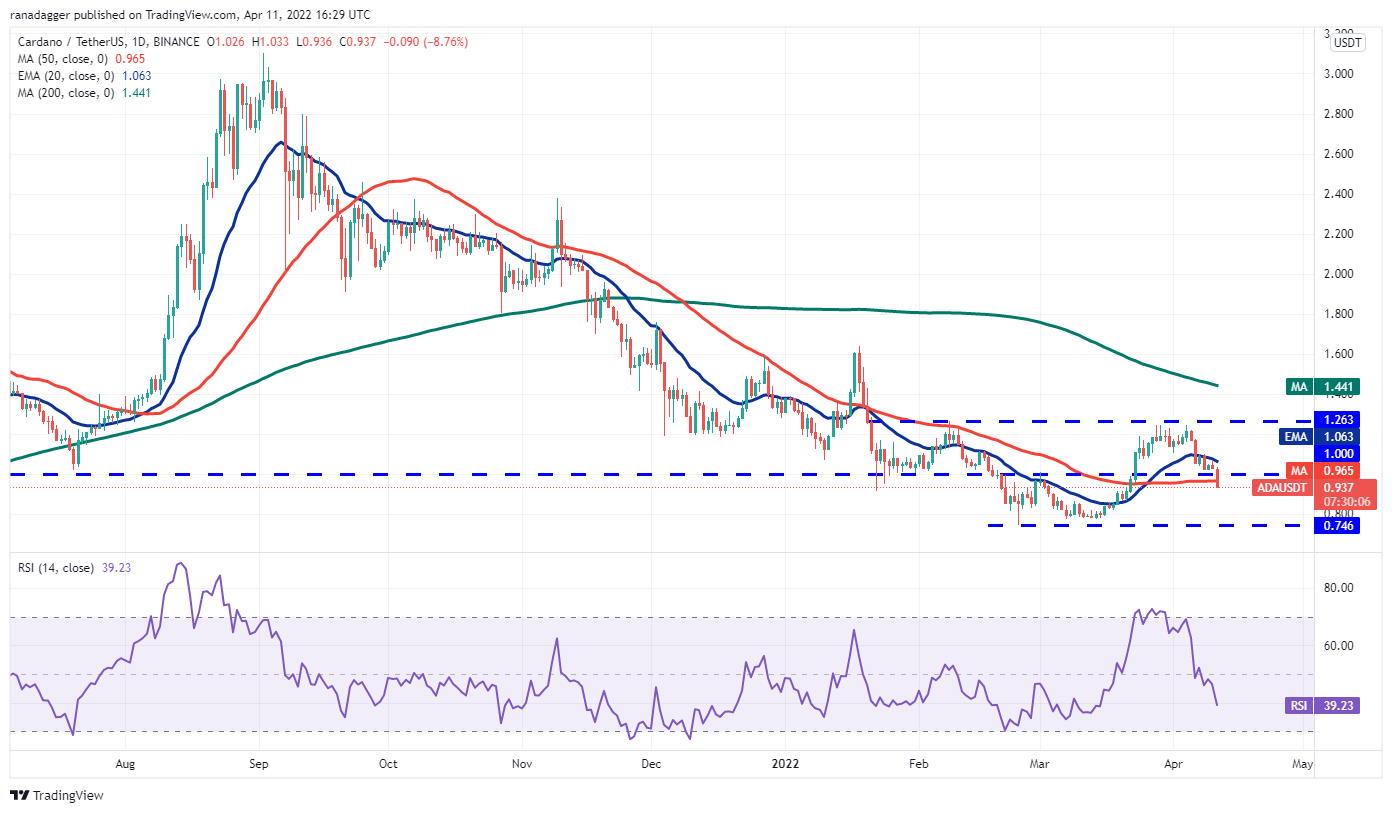
There’s a good chance that ADA/USDT could fall to $0.74 if the price stays below the 50-day SMA.
People say that the bears should fight for this level with all their strength, because it’s important.
A strong bounce off it could mean that the pair will stay in a big range between $0.74 and $1.26 for a few days.
This isn’t true. If the price rises above the 20-day EMA from where it is now, it will show strong buying at lower prices.
That could make it hard to trade between the 50-day SMA and $1.26.
LUNA/USDT
Turquoise LUNA token fell below the 20-day EMA ($99) on April 8 and closed below the level on April 7.
April 9 was a bad day for the bulls. They tried to make a comeback, but they couldn’t get past the 20-day EMA.
A lot more people may have sold because of this, and the price has dropped below the 50-day SMA ($90).
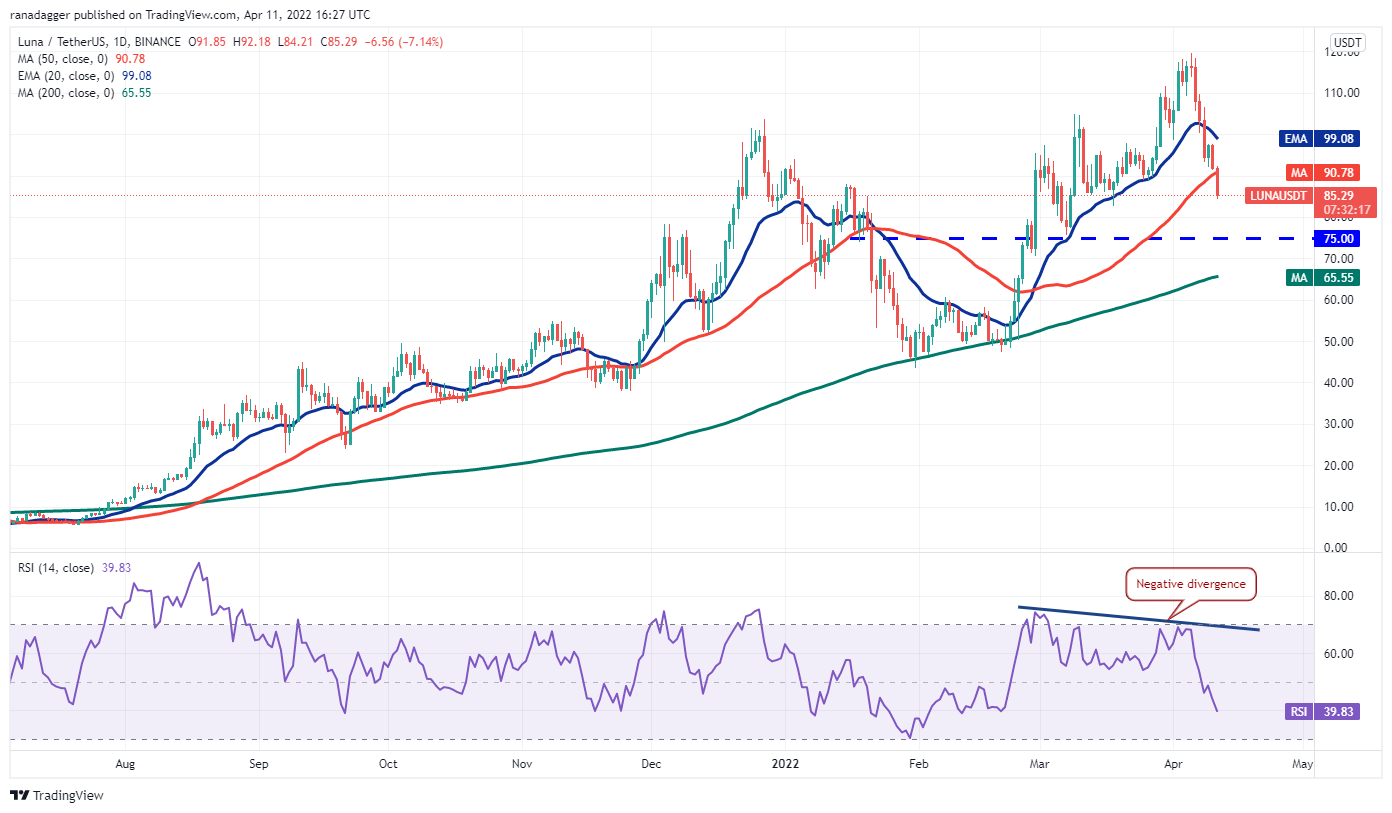
As you can see, the 20-day EMA has turned down and the RSI has dropped into the negative zone, which means the bears are now in the lead.
If the price stays below the 50-day SMA, the chances of a drop to $75 go up.
The 200-day SMA could be the next place to go if this level also breaks.
On the other hand, if the price rises from where it is now and goes above the 50-day SMA, it will show that there is a lot of demand at lower prices.
The bulls will then try to push the price above the 20-day EMA again.
AVAX/USDT
Bulls couldn’t keep Avalanche (AVAX) above the 20-day EMA ($86) on April 8, which means the bears are protecting this level.
This may have caused more people to sell, and the price fell below the 50-day SMA ($82) on April 10.
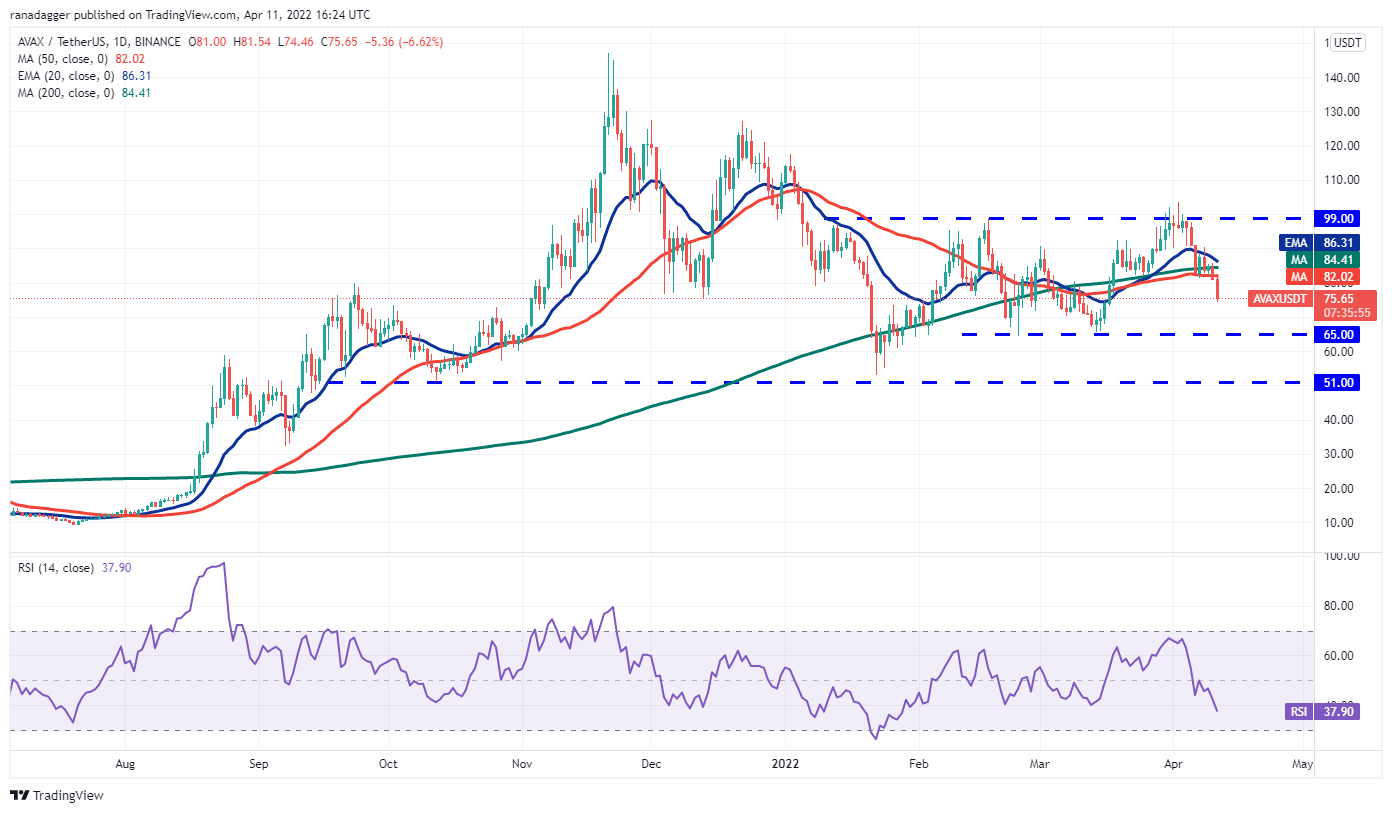
The 20-day EMA has turned down and the RSI is in the negative zone, which means that the bears have the upper hand.
To get the price down to $65, the sellers will try to push it there.
This means that the AVAX/USDT pair could move back and forth between $65 and $99 for a few more days.
If the price moves up from where it is now, the bulls will try to push the pair above the 20-day EMA and try to break through the $99.9 level of resistance.
DOT/USDT
Polkadot (DOT) failed to push above the 20-day EMA ($20) from April 8 to 10, which may have caused some people to sell.
There is strong support at $19, but that has caused the price to fall below that.
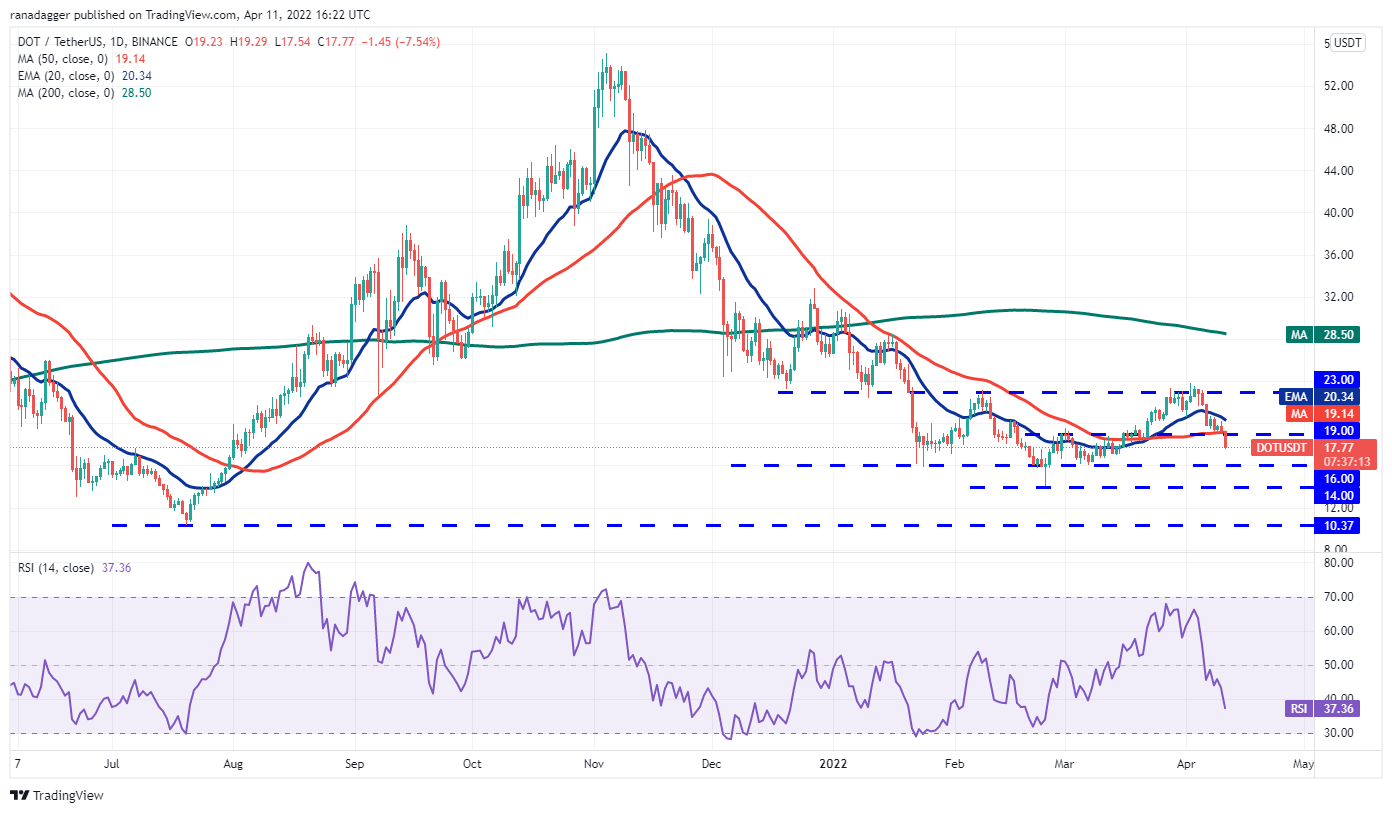
If the 20-day EMA goes down and the RSI goes down, it means that bears have the upper hand.
The DOT/USDT pair could now fall to $16, which is likely to be a strong support for the pair now.
It could stay between $16 and $21 for a few more days if the price goes back up.
It’s likely that the next trending move will start when the price breaks below $16 or when the price rises above the $21 level.
DOGE/USDT
Dogecoin (DOGE) tried to go up on April 10, but the long wick on the candlestick shows that bears sold when the price was higher.
The bears will now try to keep the price below the 20-day EMA ($0.14).
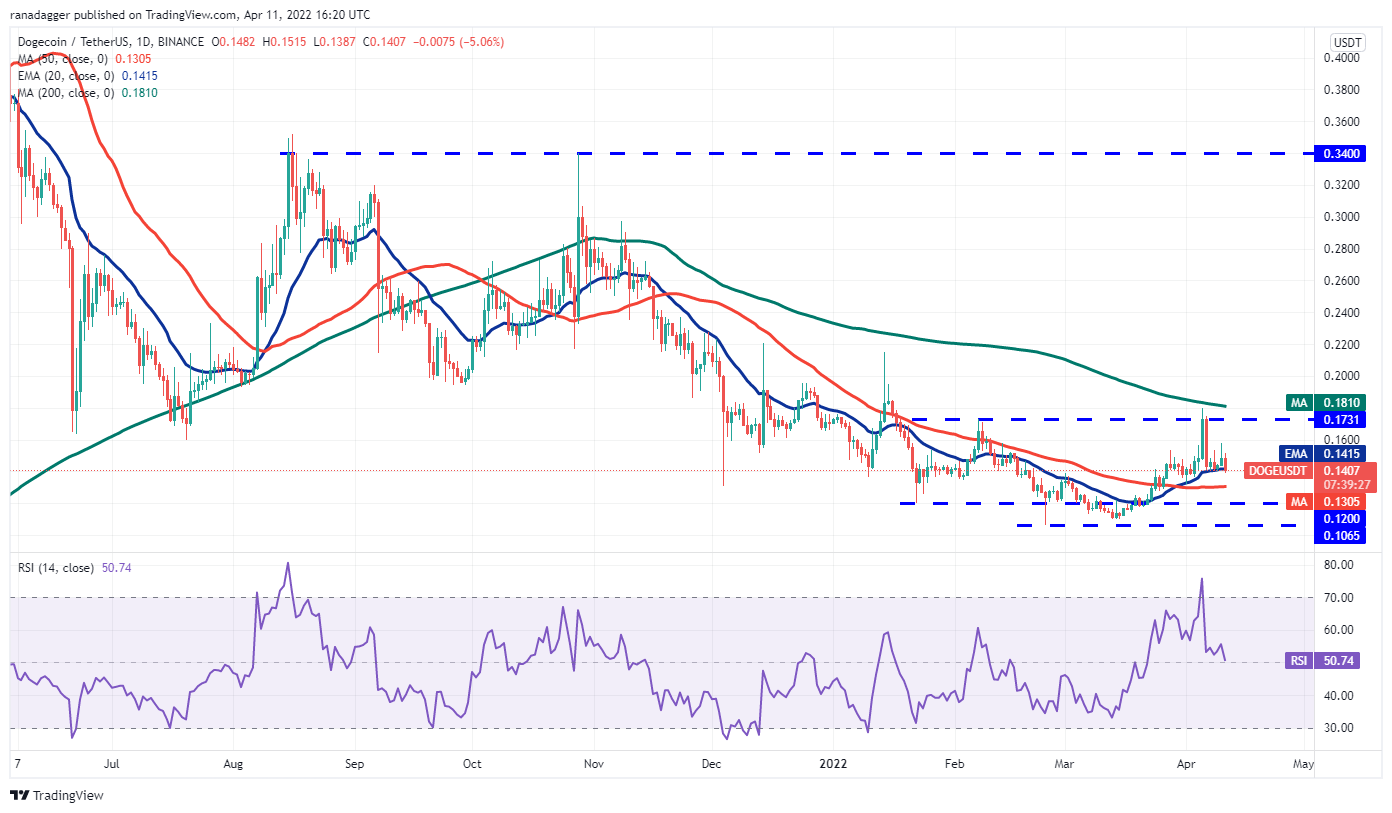
A drop in the DOGE/USDT pair to the 50-day SMA ($0.13) could happen.
So, if the pair makes a move like this, it could stay in the middle of the big range between $0.17 and $0.10 for a while.
The flattening 20-day EMA and the RSI near the middle also suggest that the market is going to be stable in the near term.
As soon as the price comes back up, the bulls will try to push the pair to $0.17 again.
When the 200-day SMA ($0.18) breaks and closes above the current price, it could be the start of a new upward trend.
The author’s thoughts and opinions are entirely his or her own and do not necessarily reflect those of CoinNewsDaily. Each investing and trading action entails risk; before making a decision, you should conduct your own research. Market data is provided by HitBTC exchange.


