


Bitcoin (BTC) and Ether (ETH) have regained a significant portion of the losses sustained in response to China’s regulatory crackdown on Sept. 24.
This indicates that the crypto markets have absorbed the news-driven selling, with long-term investors likely accumulating on the drop.
However, a rally may have to wait while market players await the conclusion of this week’s infrastructure bill, which is expected to begin discussion on Sept. 27 and conclude on Sept. 30. While the broad definition of a „broker“ may produce some volatility in the cryptocurrency markets, HODLers are unlikely to be disturbed.


According to analyst Willy Woo, Bitcoin has reached the Astley Cycle’s Never Gonna Give You Up phase, which might be followed by a surge.
On one end of the spectrum are the “Rick Astley” investors, while on the other is JPMorgan CEO Jamie Dimon, who remains adamant in his rejection of Bitcoin.
Dimon stated in an interview with The Times of India that he will not purchase Bitcoin even if its price doubles in the next five years.
Is it possible for Bitcoin to prolong its rebound in the coming days, or is a range-bound action more likely?
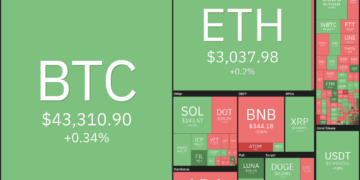
To learn more, let’s examine the charts of the top ten cryptocurrencies.
BTC/USDT
For the past several days, bitcoin has been bouncing between the 100-day simple moving average (SMA) ($41,078) and the 20-day exponential moving average (EMA) ($44,982), indicating that bulls are buying on falls and bears are selling on rallies, respectively.

The 20-day exponential moving average (EMA) is sloping downward, and the relative strength index (RSI) is slightly below the midway, indicating that the path of least resistance is to the downside. If bears continue to lower the stock below the 100-day SMA, selling could get more intense.
The BTC/USDT pair could then fall to $37,332.70, and if this level also caves in, the loss might reach $30,000.
This negative perspective will be invalidated if the price moves above the moving averages and breaks above the current level. Such a move would imply that the bulls have re-entered the game. After that, the pair might rally to $48,843.20 and ultimately to $52,920.
ETH/USDT
The lengthy tail on Ether’s candlesticks over the last three days indicates that bulls are aggressively purchasing near the 100-day simple moving average ($2,756).
As a result, this becomes a critical level to monitor.

The 20-day exponential moving average ($3,193) is sloping downward, and the RSI is barely below the midway, indicating a minor bearish bias. If the price declines from its current level, the ETH/USDT pair may consolidate for a few more days between the moving averages.
If the pair breaks and closes below the 100-day SMA, selling could get more intense, and the pair could fall to $2,400, followed by a decline to $1,972.12. On the other side, the first indicator of strength will be a break and close above the 20-day EMA. The pair’s value may then reach $3,600.
ADA/USDT
On Sept. 25, bulls pushed Cardano (ADA) above the moving averages, but they were unable to clear the $2.47 resistance. This indicates that bears have not abandoned their positions and are selling on rallies to key overhead resistance levels.

The price of the ADA/USDT pair has fallen, and the bears will now attempt to drive the price down below the important support level of $1.94. This is a critical level for the bulls to defend because if it is breached, the pair is likely to enter a downward spiral.
On the other hand, if the price moves higher from its current level or rebounds from $1.94, the bulls will attempt to push the pair above $2.47 once more. If they are successful in doing so, it will suggest that the correction may have come to an end. After that, the pair might rise to $2.97.
BNB/USDT
On September 26, Binance Coin (BNB) fell below the support level of $340, but bulls pounced on the weakness and kept the level in place on a closing basis.
At the moment, buyers are battling to keep the price above $340, signaling that they will sell on tiny rallies.

It’s possible that the BNB/USDT pair will drop below $300 and then to $250 if the price continues to deteriorate and breaks below the $340 to $320 support zone. The 20-day exponential moving average ($388) is sliding downward, and the RSI is below 37, indicating that bears are in control.
The first indication of strength will be a break and closing above the 20-day exponential moving average. Such a move will provide the impression that the selling pressure is lessened. The pair could then rally to $433, which represents the overhead resistance.
XRP/USDT
In the previous few days, Ripple (XRP) has frequently bounced off the 100-day simple moving average ($0.88), signaling that bulls are vigorously defending the support level. Now, the bulls will attempt to push the price above the overhead resistance zone that exists between the 20-day exponential moving average ($1.02) and the 50-day simple moving average ($1.10).

If they are successful in doing so, it will signal that the correction may have come to an end. If the XRP/USDT pair continues to increase, it might reach $1.41, where bears may mount another strong resistance.
Bears are in command, as indicated by the downward-sloping 20-day exponential moving average and the RSI in the negative zone. If the price begins to decline from the 20-day exponential moving average, the pair may drop to the 100-day simple moving average. If this level is maintained, the pair may be trapped between the moving averages for a few days.
If bears are able to keep the price below the 100-day simple moving average, the second leg of the down trend could commence. This might pave the way for a probable reduction to $0.69 in the future.
SOL/USDT
Solana (SOL) has broken free of the downtrend line and the 20-day exponential moving average ($143), indicating that the bears may be losing their grip on the stock. The 20-day exponential moving average has flattened out, and the relative strength index (RSI) is just over the midpoint, indicating that supply and demand are in balance.

If the bulls are able to push the price above $152.50 and keep it there for an extended period of time, the short-term advantage could shift in their favor. The SOL/USDT pair might then climb to $171.47, where the bears are likely to mount another strong counter-attack.
Bears will attempt to bring the price down to its 50-day simple moving average ($114) if it starts declining from its current level or from the overhead barrier. A break and closing below this support level could indicate a reversal in the trend. A break and close over $171.47, on the other hand, may drive the pair all the way up to $200.
DOT/USDT
However, despite breaking below the 50-day simple moving average ($28.76) on September 26, the long tail on the day’s candlestick indicates that bulls are attempting to defend the neckline of the head and shoulders pattern.

On today’s trading session, buyers attempted to push the price over overhead resistance at the 20-day moving average ($30.91), but the lengthy wick on the day’s candlestick shows that bears are selling on rallies.If bears are able to push the DOT/USDT pair below the 50-day simple moving average, a retest of the neckline is likely.
A break and close below this support will complete the bearish H&S pattern, with a pattern target of $12.23 as a result of the break and close below this support.
The pair might increase to $33.60, and later to $38.77, if bulls are able to push the price above the downtrend line, according to the chart.
DOGE/USDT
On September 24, Dogecoin (DOGE) saw a precipitous drop and closed below the $0.21 support level. The price fell to $0.19 on September 26 as a result of sustained selling, but the positive indicator is that bulls defended this level strongly, as evidenced by the extended tail on the candlestick for the day.

The bulls are making an attempt to push the price over the overhead resistance level of $0.21 per dollar. If they are successful, the DOGE/USDT pair may advance to the 20-day exponential moving average ($0.23), which is expected to act as a strong resistance.
If the price continues to decline from the 20-day moving average, the bears may be able to push the pair down to $0.19. If the pair breaks and closes below this support, it might fall as low as $0.15. In contrast, a break and closure above the 20-day exponential moving average (EMA) could result in an up-move to the 50-day simple moving average ($0.26).
AVAX/USDT
The lengthy tail on Avalanche’s (AVAX) candlestick from September 26 implies that there is considerable demand for the stock at lower levels. After this, the bulls will attempt to drive the price up to its all-time high of $79.80.

The return of the uptrend will be signaled by a breakout and close above the previous all-time high. Although the bears may attempt to block the up-move at the resistance line of the channel, it is possible that bulls will overcome this obstacle and the AVAX/USDT pair will gain momentum and rally all the way to $101.
Alternatively, if the price continues to fall from its current level and breaks below the support line of the channel, the pair may begin a more significant decline and correction. Alternatively, a break below the breakout level at $60.04 may herald the start of a slide below the 50-day simple moving average ($46.23).
LUNA/USDT
The price of Terra protocol’s LUNA token fell from $41.28 on September 24 to $34.51 today, a positive indicator that bulls did not allow the price to fall below the 20-day exponential moving average ($34.51). Bulls are buying on falls, and bears are selling on rises, as indicated by this pattern.

According to the indications, buyers are gaining an advantage due to the upward slope of the moving averages, while sellers are losing an advantage due to the negative divergence on the relative strength index (RSI), which indicates that the bullish momentum may be waning.
If bulls are able to push the price above the downtrend line, the LUNA/USDT pair might retest its all-time high of $45.01 at some point in the future. An upward break and closing above this resistance level will indicate that the uptrend has resumed.
Alternatively, if the price declines from the current level or the downtrend line and breaks below the 20-day exponential moving average (EMA), the loss might extend to the 50-day simple moving average ($30.43) and beyond.
The author’s thoughts and opinions are entirely his or her own and do not necessarily reflect those of CoinNewsDaily. Each investing and trading action entails risk; before making a decision, you should conduct your own research. Market data is provided by HitBTC exchange.


