


When we examine Bitcoin (BTC) in its current state, we see that it is embroiled in a fierce battle between bulls and bears near the $31,000 mark, which makes it a critical level to monitor in the near future. According to Glassnode data, buyers and sellers have been extremely active in the $31,000 to $34,300 range over the last 24 hours. Indeed, this range encompasses 9.93 percent of the Bitcoin supply.
According to the data, bitcoin’s inability to rapidly rally from strong support levels indicates a lack of market demand for the cryptocurrency. According to Larry Fink, a financial services executive who spoke with CNBC recently, investor demand for cryptocurrencies has decreased in recent months, demonstrating the widespread disinterest in cryptocurrencies at the moment. Fink reported that during his most recent two weeks of business travel, he did not receive a single question about Bitcoin or cryptocurrency investing.


According to data compiled by ByteTree Asset Management, the amount of money flowing into Bitcoin funds in the United States and Canada has decreased by 93.49 percent in just 90 days, from 191,846 Bitcoin in January to 12,485 Bitcoin in February.
According to DoubleLine CEO Jeffrey Gundlach, head-and-shoulders trading patterns „appeal to be fairly convincing“ in a July 14, 2021 interview with CNBC. Gundlach predicts that the head-and-shoulders pattern will cause Bitcoin’s value to fall below $23,000.
Do you believe Bitcoin will break through the support level and begin the next leg of its decline, or do you believe it is due for a recovery? A detailed examination of the charts of the world’s most valuable cryptocurrencies will assist us in determining the critical levels to monitor.
BTC/USDT
Bitcoin has spent the last two days trading near the $31,000 support level. Failure to make a strong rebound off this critical support level is a bearish sign, implying a lack of strong demand at these levels.
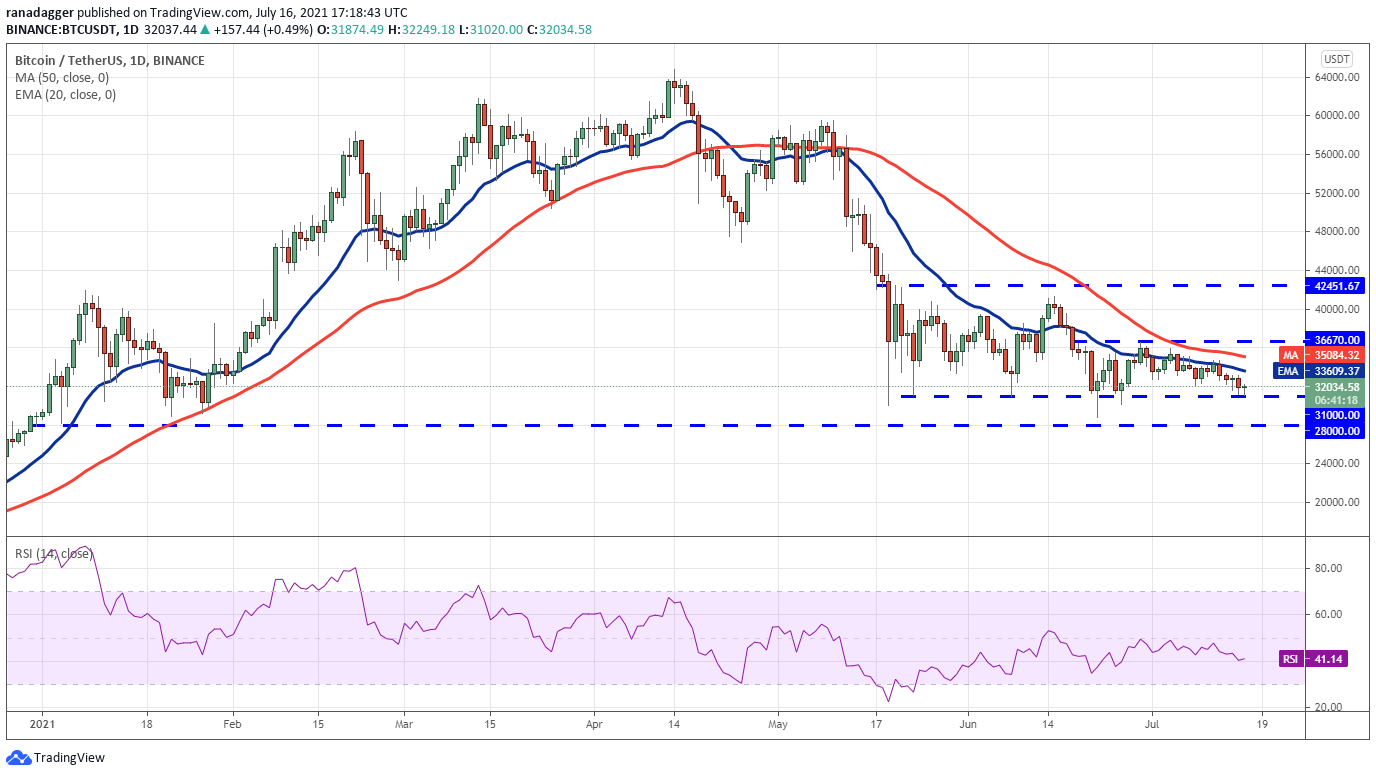
This is indicated by the downward sloping moving averages and the negative relative strength index (RSI), indicating that the bears are in control of the market. A break and close below $31,000 could pave the way for a decline to the next support level at $28,000.
A sharp price rebound from the $31,000 to $28,000 range will signal an opportunity for investors to accumulate at lower levels. Within a short period of time, bulls will attempt to push the price above its moving averages.
There will be no indication of a potential trend change until Bitcoin breaks out and closes above its 50-day simple moving average ($35,084).
However, if the price falls below $28,000, bearish momentum may resume, and the BTC/USDT pair could fall to as low as $20,000 in a matter of days, according to the most recent forecast.
ETH/USDT
Despite a relief rally in Ether (ETH) on July 14, the cryptocurrency was unable to break above its 20-day exponential moving average ($2,097). This indicates that traders remain bearish on the market and are selling on any slight increase in price. The most valuable altcoin may now be on the verge of testing the critical support level of $1,728.74.
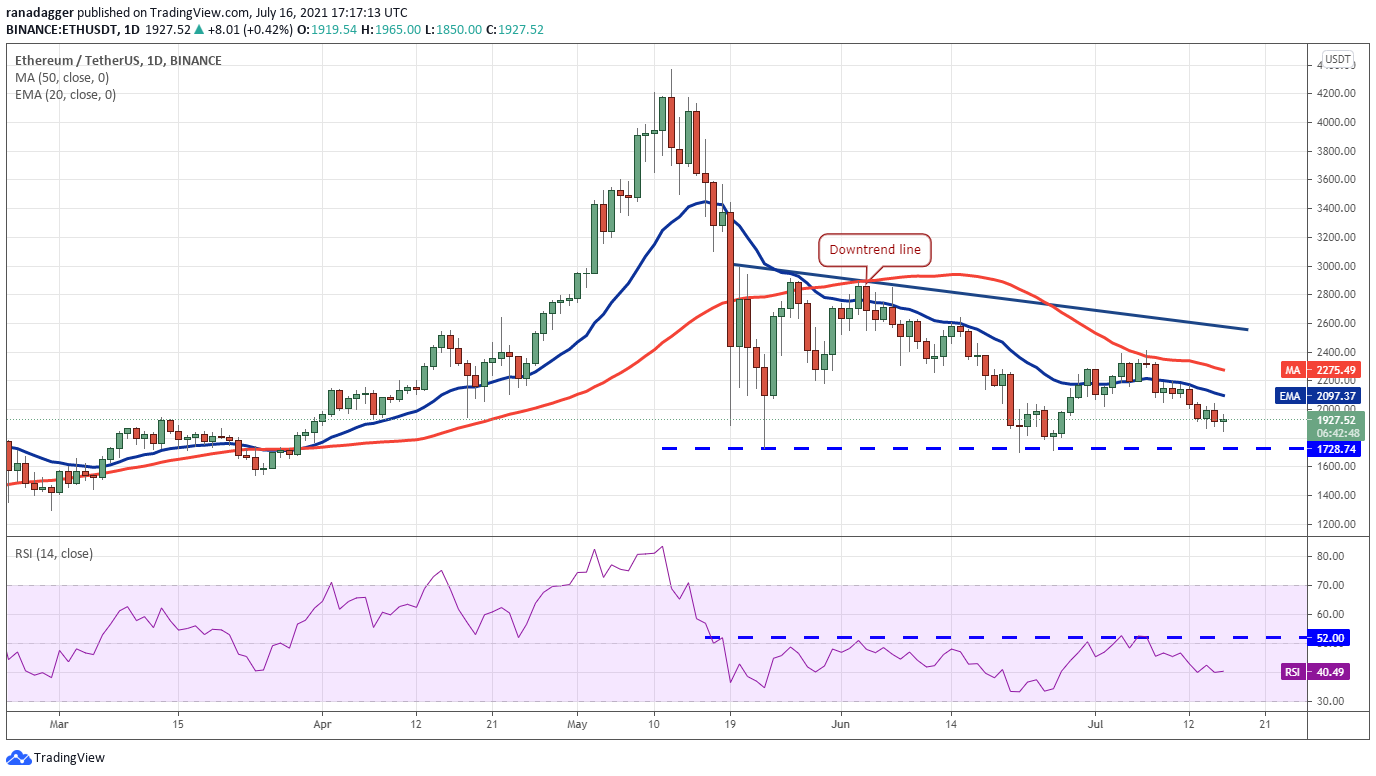
The RSI is below 41, and both moving averages are sloping downward, implying that the bears are in control of the market. According to the chart, if bears are successful in pushing the price below $1,728.74, the ETH/USDT pair will form a bearish descending triangle pattern.
If this occurs, the downtrend may resume, with potential targets at $1,536.92 and then $1,293.18.
If the price rebounds off the $1,728.74 support level, contrary to this assumption, the bulls will make another attempt to break through it. If they are successful, they may be able to rally the pair back to the downtrend line.
BNB/USDT
In recent days, BNB has been trading near the 20-day exponential moving average ($313), which has acted as a significant support level for the cryptocurrency. On July 14th, despite the price falling below the 20-day moving average, the day’s candlestick’s long tail indicated that buyers were actively seeking lower prices.
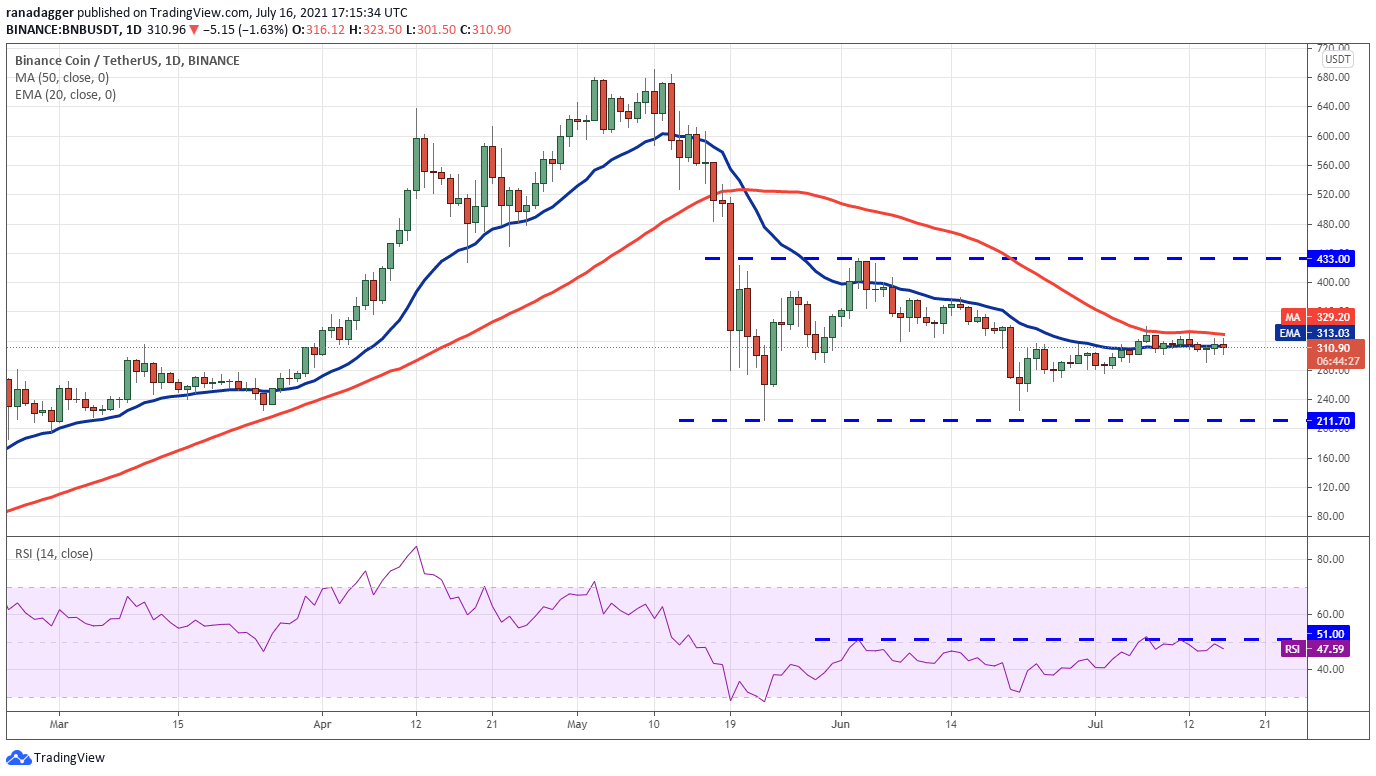
Although buyers attempted unsuccessfully on July 15, the price did not rise above the previous day’s 50-day simple moving average ($329). This action demonstrates that the bears have not given up and are still defending the 50-day simple moving average with zeal and determination. Because the moving averages are flat and the relative strength index (RSI) is just below the midpoint, supply and demand have reached equilibrium.
A breakout above the 50-day simple moving average will signal strength, followed by a close above it in the following days. If the price reaches $379.58, bulls will attempt to push it even higher, possibly as high as $400.
Alternatively, a close below the $276.40 to $264.26 support zone will indicate a bearish advantage for the remainder of the trading session. As a result, the unit price may fall as low as $211.70.
ADA/USDT
Due to the fact that Cardano (ADA) failed to recover from $1.19 on July 14 and climb above the $1.28 level, bears are aggressively defending the $1.28 level. The price has decreased in the last week, from $1.28 on July 15 to less than $1.19 today.
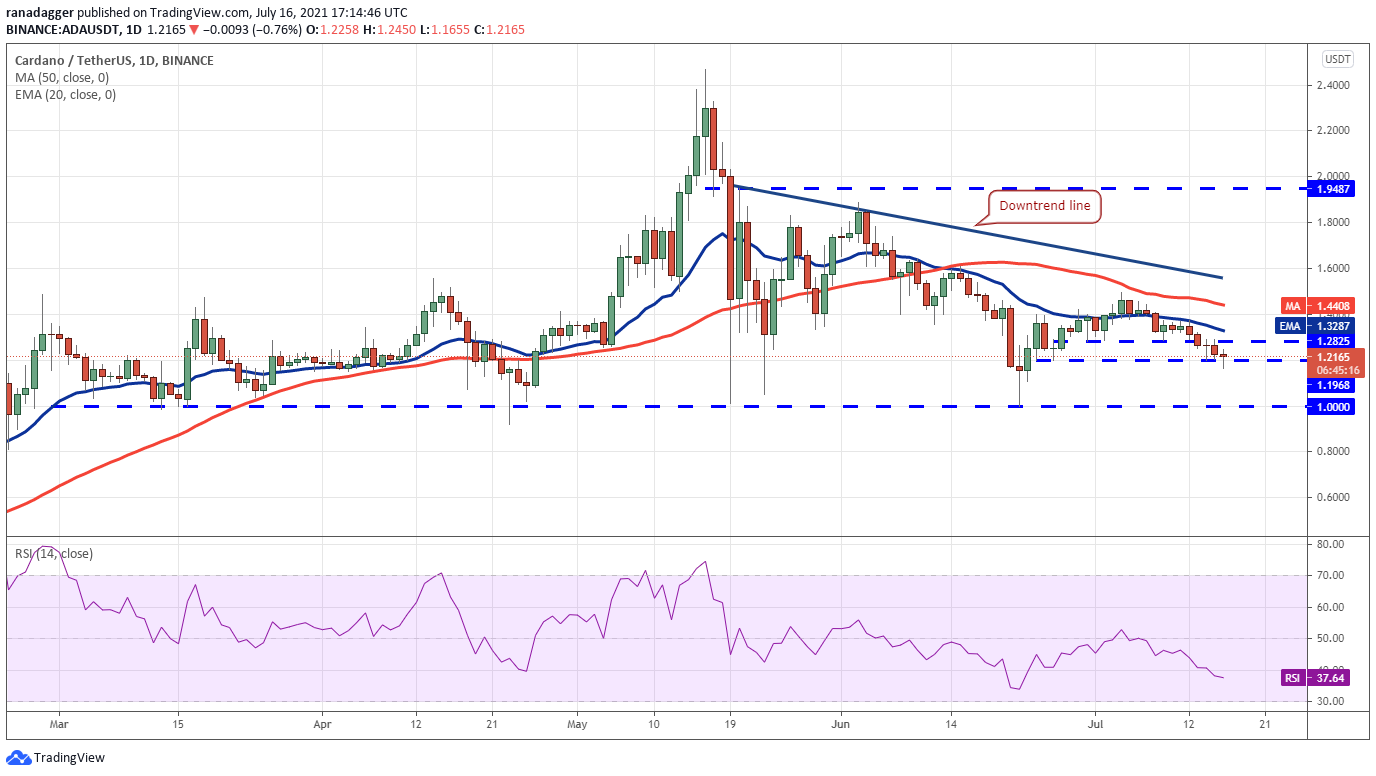
Bulls are attempting to halt the decline and kick-start a relief rally for the second time in as many trading sessions, as indicated by the long tail on today’s candlestick. The beginning of a period of strength will be signaled by a breakout and close above the 20-day exponential moving average ($1.32).
After that, the pair may rise to the 50-day simple moving average ($1.44), a critical support level.
If bears gain enough momentum, they may be able to drive the ADA/USDT pair even lower, possibly as low as $1.19. If this occurs, the pair could fall further, possibly to $1.10. Alternatively, a break below this support level could result in a retest of the critical support level of $1. It has been held several times since February 26, and the bulls intend to do so again in the near future.
A strong rebound from $1 indicates accumulation at lower levels, but if the rebound is sustained, the bulls will almost certainly run into stiff resistance at $1.19, indicating that the bulls have run out of steam. It is more likely that the price will continue to fall from here and break through the $1 mark. If this occurs, the pair is likely to revert to the downside, with the next support level at $0.80 acting as a stepping stone.
XRP/USDT
For the past two days, the bulls have been attempting to defend the $0.59 support but have been unable to achieve a strong rebound off it. This indicates a lack of urgency on the part of traders to purchase XRP at current levels.
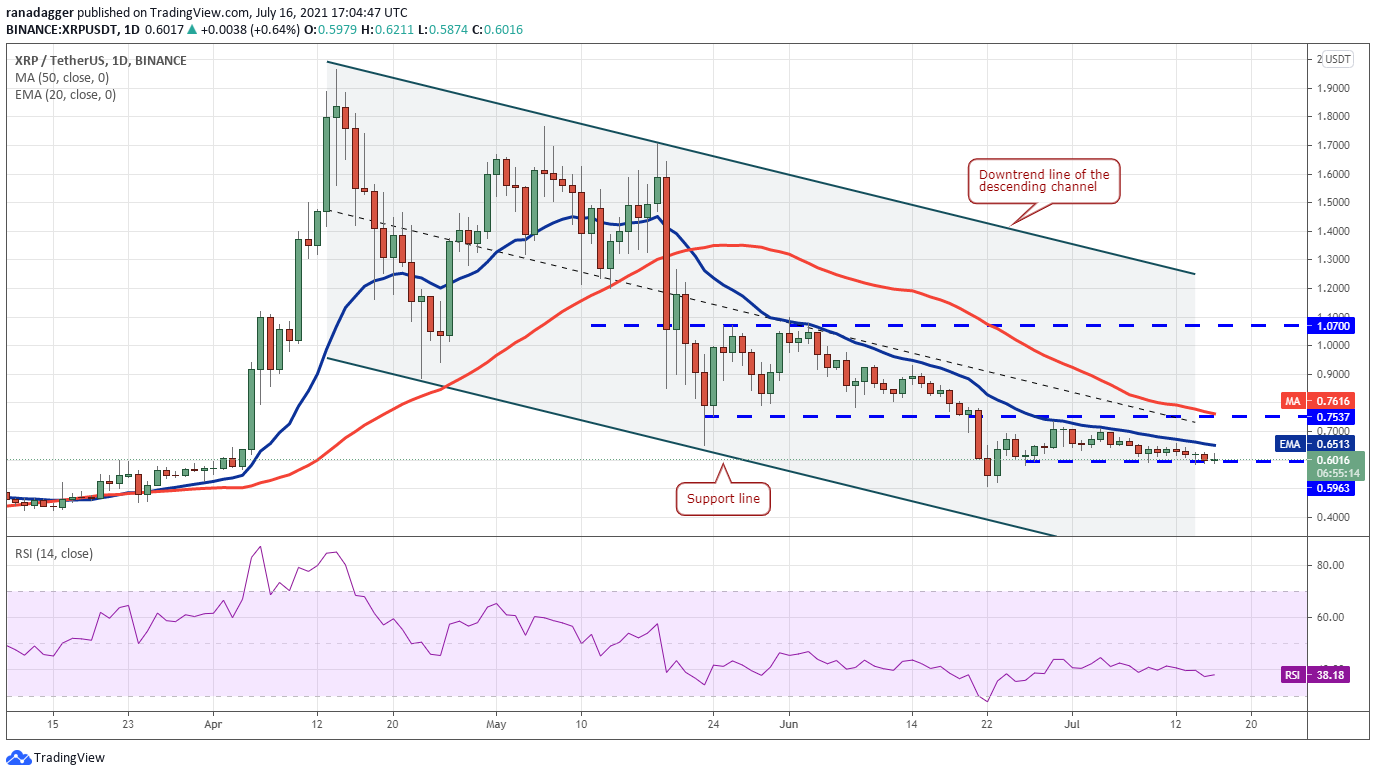
Moving averages on the downside and an RSI below 39 indicate that bears have the upper hand.
If the price breaks and closes below $0.59, it may fall to the critical support level of $0.50.
If the price recovers strongly from $0.50, bulls will attempt to push the XRP/USDT pair above the 20-day exponential moving average ($0.65). If they succeed, the pair may trade as high as $0.75.
On the other hand, if bears manage to push the price below $0.50, the pair may fall to the next support level at $0.45 and eventually to $0.40.
DOGE/USDT
Dogecoin’s (DOGE) downward trend has continued, edging closer to the critical support level of $0.15. This level has previously held on two occasions, and thus the bulls will make another aggressive attempt to defend it.
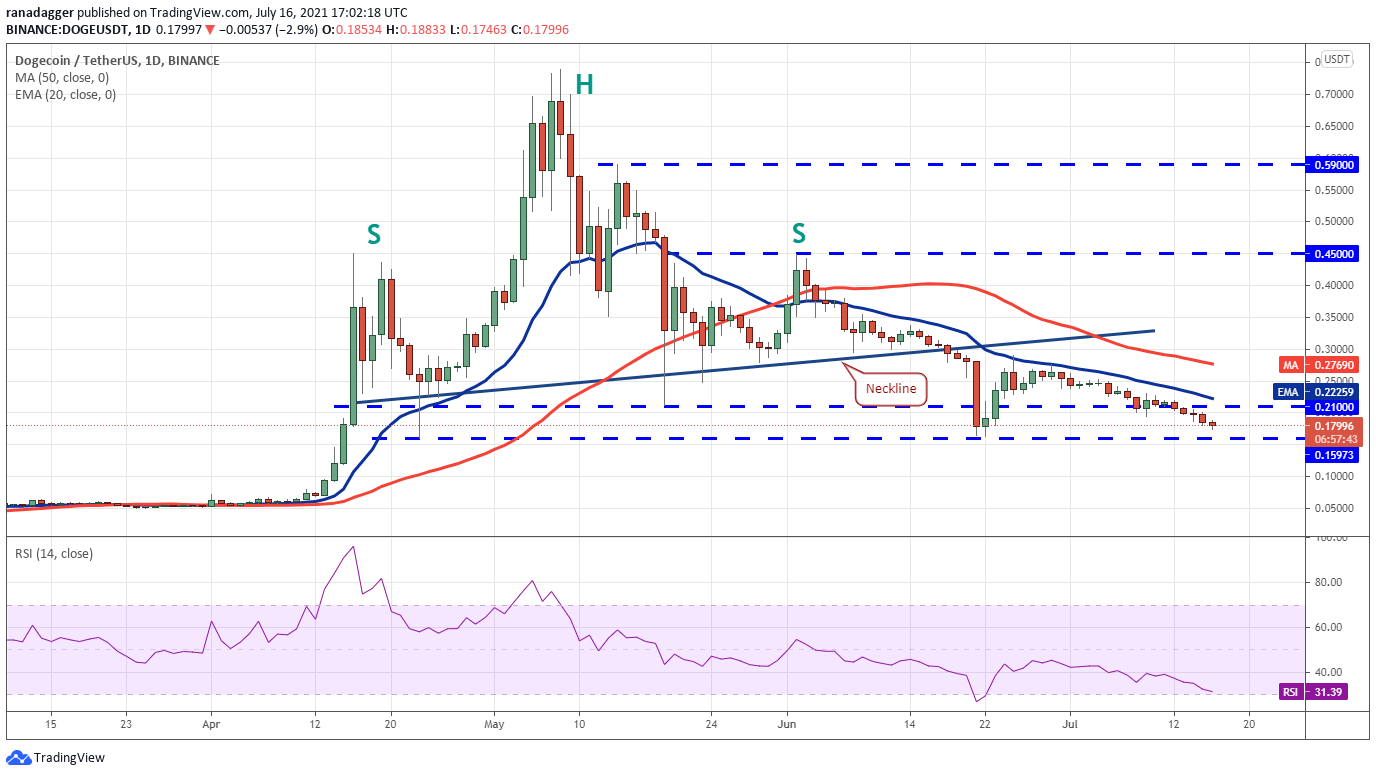
Bulls will attempt to push the price above the 20-day exponential moving average ($0.22) if the price recovers from $0.15. If they succeed, it may herald the start of a relief rally toward the 50-day simple moving average ($0.27).
On the other hand, if bears manage to push the price below $0.15, selling may accelerate as traders flee.
This could result in a drop to $0.10 and ultimately to $0.07. The downward-sloping moving averages and the RSI near the oversold zone suggest a higher probability of a breakdown.
DOT/USDT
Over the last two days, the bulls‘ inability to reintroduce Polkadot (DOT) above $14.50 indicates a lack of demand at higher levels. This resulted in further selling today, with the altcoin falling below the critical $13 support level.
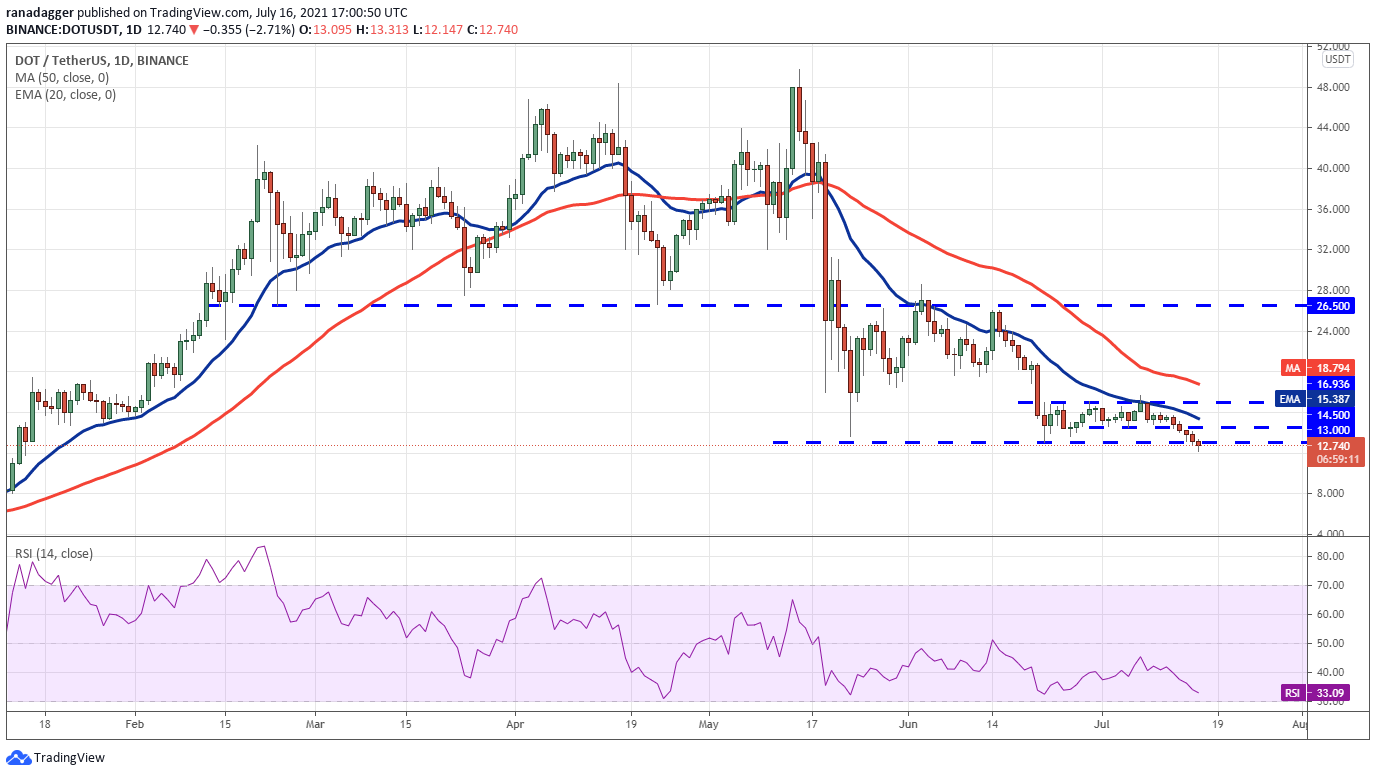
Both moving averages are trending downward, and the RSI is approaching oversold territory, indicating that bears are in control. If the DOT/USDT pair continues to fall below $13, it may test the next support level at $10.
Bulls may attempt to halt the decline at the psychologically significant level of $10, but any recovery rally will almost certainly encounter resistance at $13. If the bears succeed in converting this level to resistance, the probability of a decline to $7 increases.
A break and close above the 20-day exponential moving average ($15.38) will signal strength.
UNI/USDT
Uniswap’s (UNI) attempt to recover from the $16.93 support level reached on July 14 was unsuccessful. On July 15, the altcoin reversed course and fell below $16.93 today, but the long tail of the day’s candlestick suggests buying at lower levels.
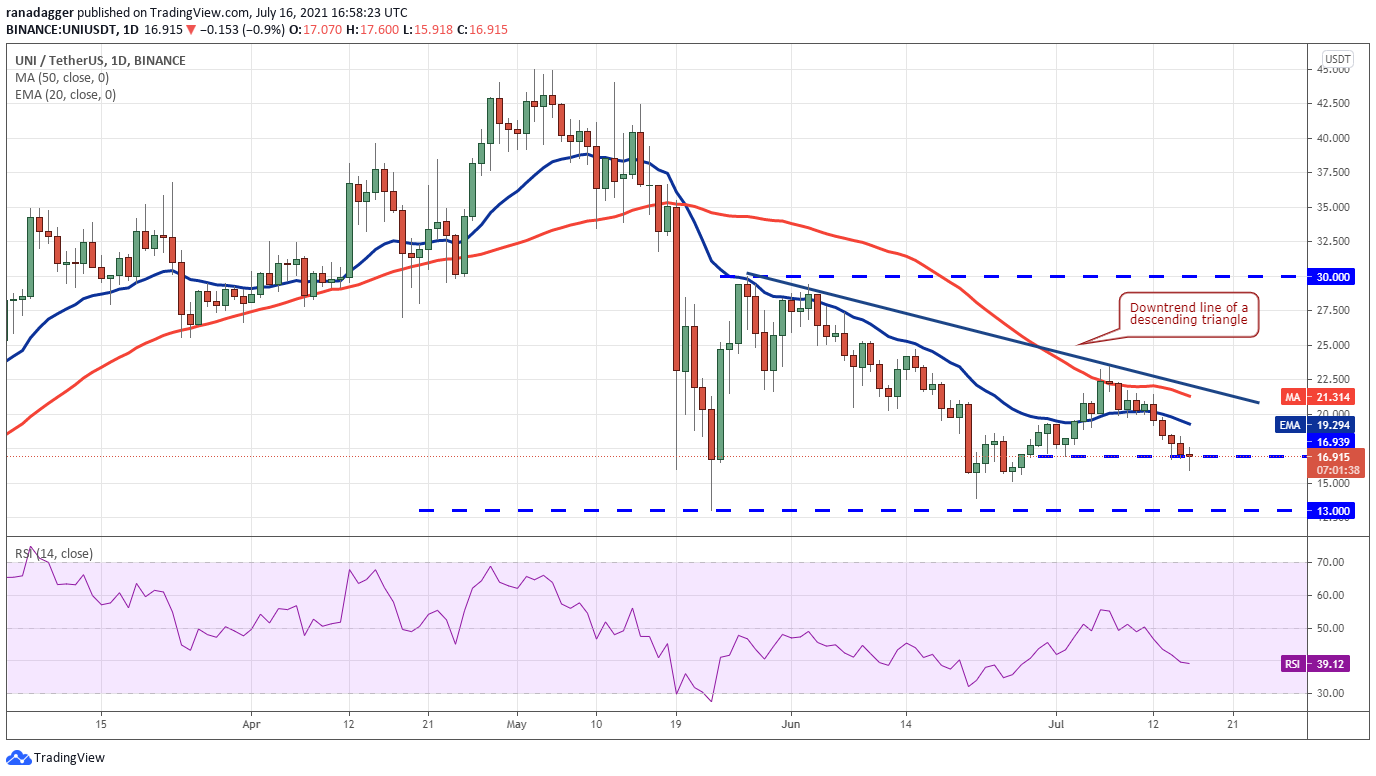
If the price remains above $16.93, the bears will attempt to re-establish the downtrend line. A break and close above this resistance level will herald the beginning of a new trend in the stock market.
If the price of the UNI/USDT pair remains below $16.93, however, the pair may fall as low as $15 and eventually as low as $13, which is a critical support level. Both moving averages have fallen below 40, indicating that the bears have re-taken control of the market.
It will be completed if the price falls below $13 to form a bearish descending triangle formation. A resumption of the downtrend is possible as a result, with the next level of support being $10, followed by $7.
BCH/USDT
When Bitcoin Cash (BCH) fell below $475.69 on July 14, bulls attempted but failed to push it back above that level. It appears as though the bears have shifted their resistance to the $475.69 level. On July 15, the altcoin reversed course and began a downward trend that has continued to this day.
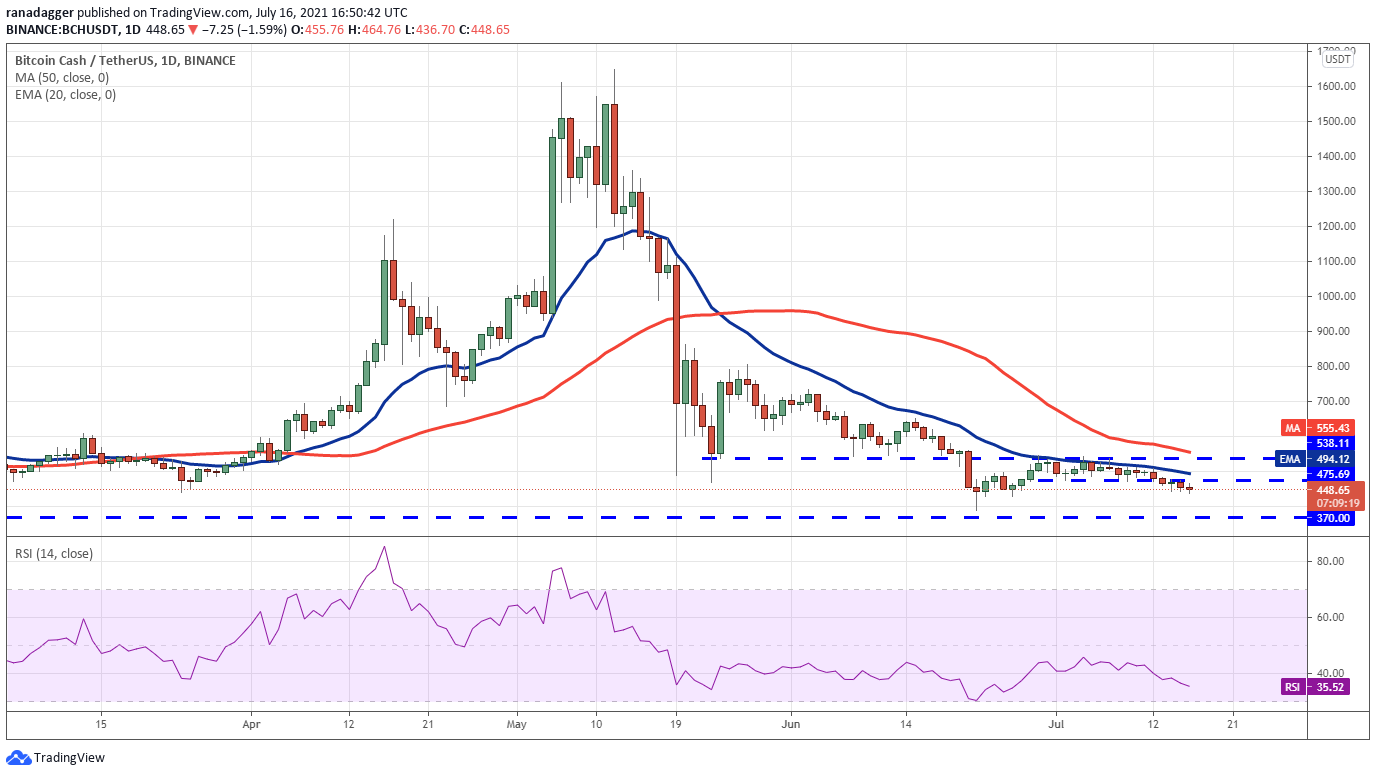
There is a sliver of support at $428. Bulls will attempt to push the BCH/USDT pair above $475.69 once more if the price rises above this level. If they succeed, the value of the pair could rise to $538.11. A break of this resistance level will indicate the possibility of a trend reversal.
Alternatively, if the price continues to fall and breaks below $428, the pair may fall to the psychological level of $400 and then to $370. Alternatively, the bears appear to be in control, as indicated by declining moving averages and an RSI reading below 36. If prices fall below $370, this could herald the start of the next leg of the downtrend.
LTC/USDT
On July 15, Litecoin’s (LTC) recovery from the $118 support level on July 14 fizzled at the downtrend line.
This indicates that bears are resolutely defending the downtrend line.
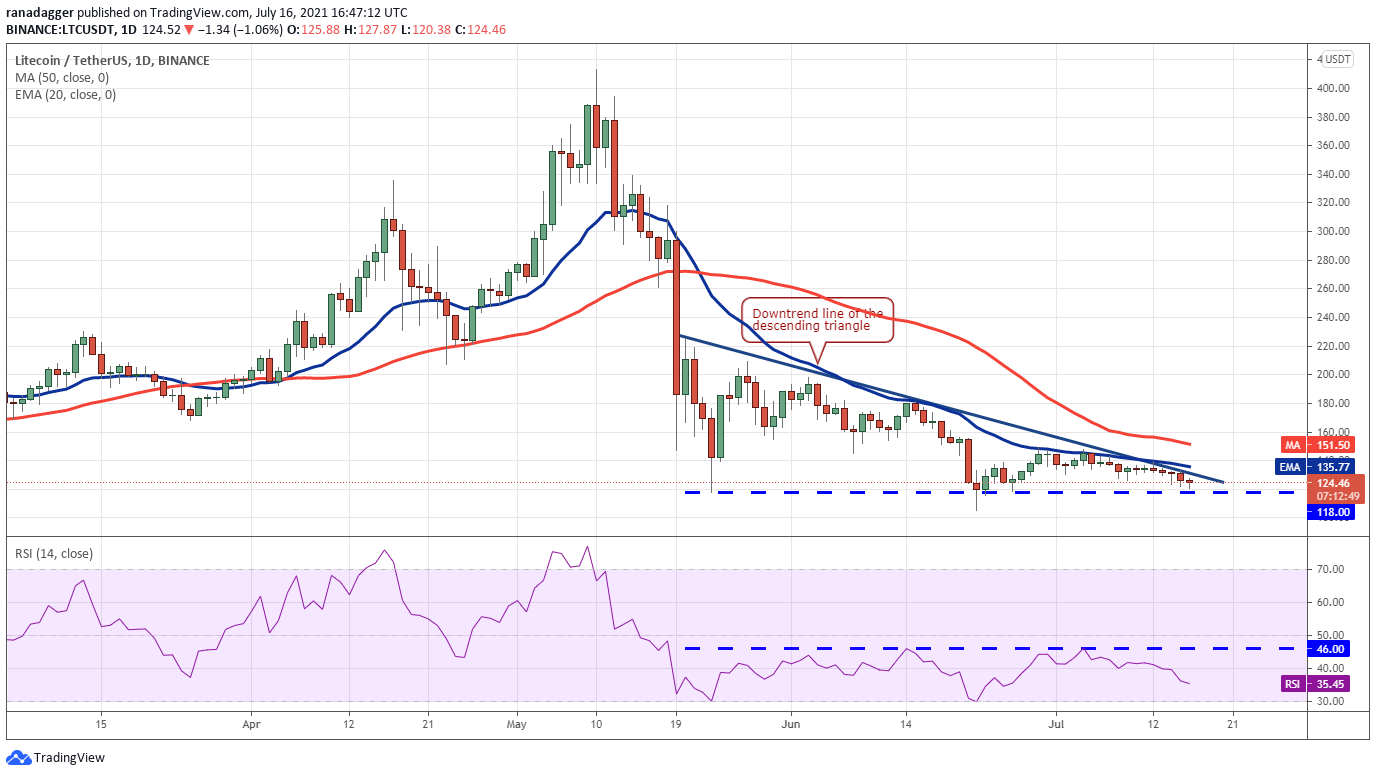
Moving averages on the downside and an RSI below 36 indicate that the path of least resistance is to the downside. If bears continue to sink and hold the price below $118, the LTC/USDT pair may fall to the $104.92 to $100 support zone.
This zone may attract buyers, but if bulls are unable to push the price above $118, selling may resume. If the price falls below $100, the decline may be extended to the next support level at $70. This bearish view will be invalidated if the price breaks above the downtrend line and returns to the current level.
Market data is provided by HitBTC exchange.
The views and opinions expressed here are solely those of the author and do not necessarily reflect the views of CoinNewsDaily. Every investment and trading move involves risk, you should conduct your own research when making a decision.


