


People who trade in the direction of the trend are more likely to make money. As soon as traders learn how to spot a new trend, they can buy with a good risk to reward ratio. When a trader sees a trend, they should also know when it changes direction.


There are many ways to tell if the trend might change, but one of the easiest is to look for the double bottom pattern. People who trade can use this to change their strategy if the trend goes from bad to good.
Let’s take a look at the double bottom pattern and figure out how to best trade it.
Double bottom: What is it?
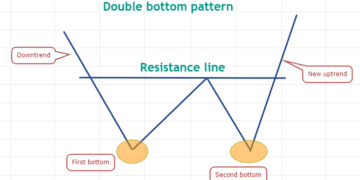
After a downtrend, a double bottom pattern is formed. It has two low points that are almost at the same horizontal level, with a small peak in between them. If price breaks out and closes above the minor peak after the second trough is formed, the set-up has been done. People who see this kind of pattern usually see a change in both the short-term and the long-term trend. It looks like a „W,“ so some people call it a „W bottom.“

This picture shows how the double bottom pattern is put together. In the past, the asset has been going down in price. At a certain price point, the bulls think the asset is undervalued and start to buy it. This helps to form the first bottom, where demand outstrips supply and a relief rally starts, so that it can happen.
However, most bears aren’t sure that the bottom is in, so they start short again after a pullback. Suddenly, when the price is close to the level where it first hit bottom, bulls start to buy again. This stops the decline and starts a new relief rally, which lasts for a few more days. The second bottom that is less than 3% of the level of the first bottom is usually considered to be valid. This is not a number that is set in stone, and real-life traders should use their own judgment when they trade.
When the price breaks through the resistance line, it means that the trend has changed from down to up. Getting the minimum goal for the pattern can be done by figuring out how far the resistance line is from the bottom and then adding the number on top of the resistance line together.
Let’s look at a few examples to help us better understand the idea.
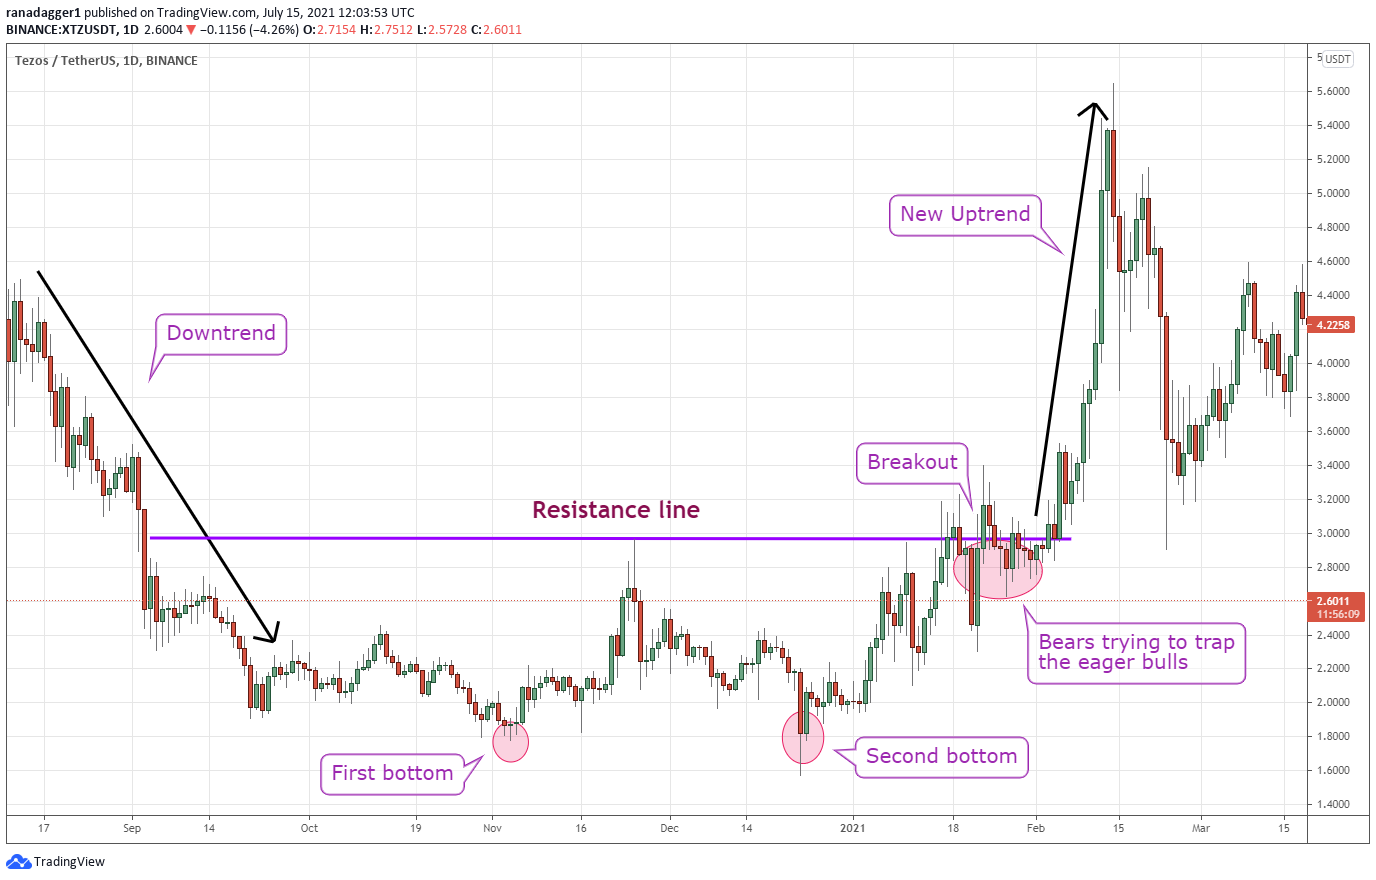
XTZ’s price was going down before it hit the first bottom at $1.78 on Nov. 4, 2020. A relief rally for the XTZ/USDT pair started there. It reached $2.96 on Nov. 25, 2020, before coming to a stop at that level. At this point, the bears again thought they had a good chance, so they sold very quickly.
It broke below the $1.78 support and fell to $1.57 on December 23, 2020, but the bears couldn’t keep the price down. Second bottom: The pair quickly recovered the next day and began to rise, forming the second bottom.
The bears fought hard to protect the resistance line and tried to trap the bulls who were eager to follow the breakout. They bought the dips, and the pair made a big move on Feb. 5, which started the new trend.
Depth: $1.18. When you add this value to the level of the resistance line at $2.96, you get a minimum pattern target of $4.14. This is how it works: However, in this case, the pair went way over the target goal and rose to $5.64 on Feb. 14.
Double bottoms can also be seen on the weekly time frame.
The double bottom pattern also works well on the daily chart. The reason for this is that when the reversal setup shows up on the weekly chart, it usually means that the long-term trend changes and the new uptrend usually lasts longer than the old one did.
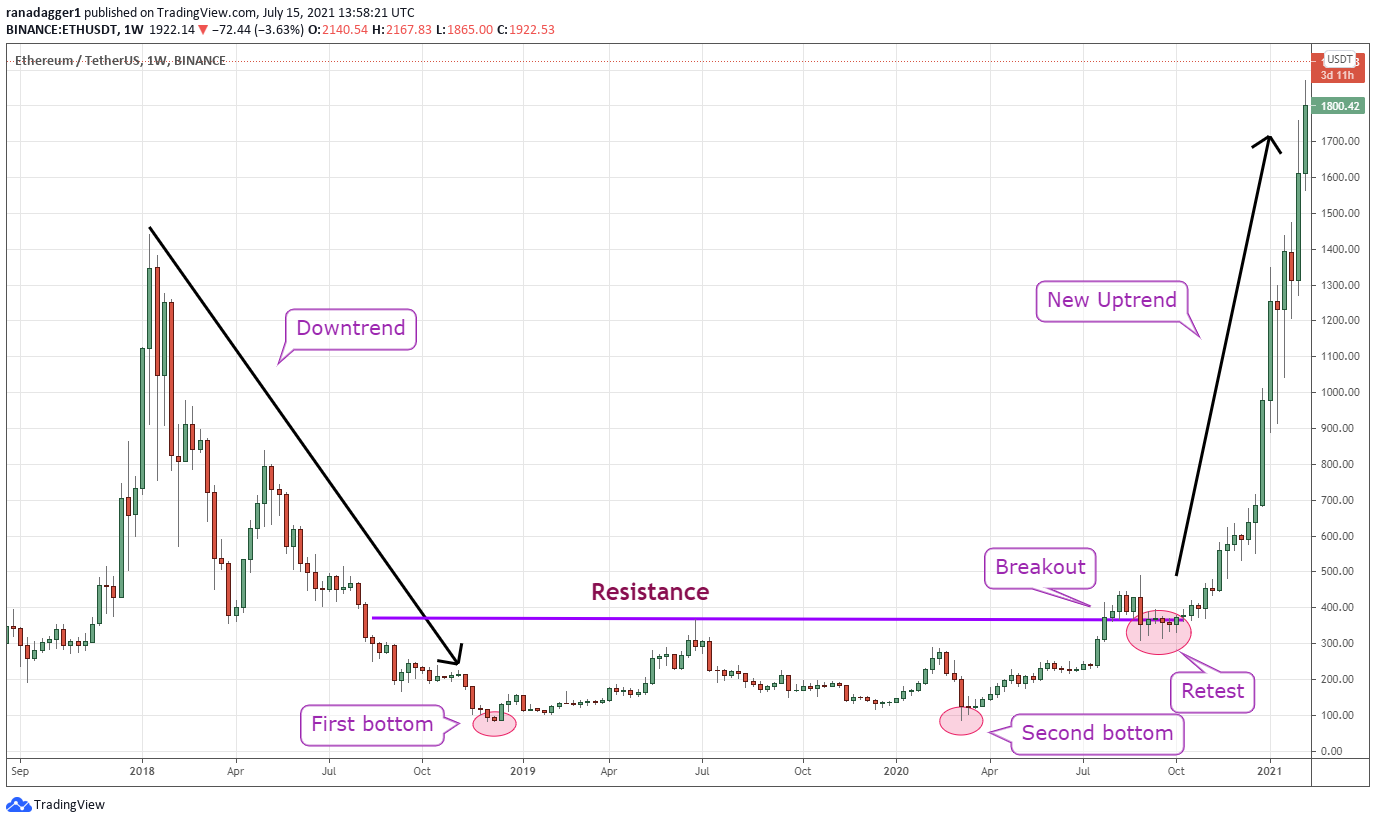
Since January 2018, Ether (ETH) had been going down a lot. It hit $1,440 in January of that year. There was more demand than there was supply when the price hit $81.70 in December 2018. This led to the first bottom. After that, the price rose to $366.80 in June 2019, where the bears again came in.
The next drop made the second bottom at $86 in March 2020. When you trade, there is no set pattern. It’s possible to think of this as a double bottom because both levels were close to each other and the price action formed a clear W.
It didn’t start a new trend because the bears tried to trap the bulls one more time. The price fell below the breakout level, but the bears could not keep the price down. In this way, it showed that people had changed their minds from selling when things went up to buying when things went down.
That was the end of the reversal, and the ETH/USDT pair started going up very quickly. As long as the minimum target was $651.90, the pair rose to over $4,300 during its bull run.
This shows that the double bottom is an important reversal pattern that can sometimes lead to strong uptrends, which is why this is important.
It can be hard to tell the truth about some bottoms at first.
Many times, traders buy before the price breaks out of the resistance line. This is called a „double bottom.“ That could lead to losses because the pattern may never finish.
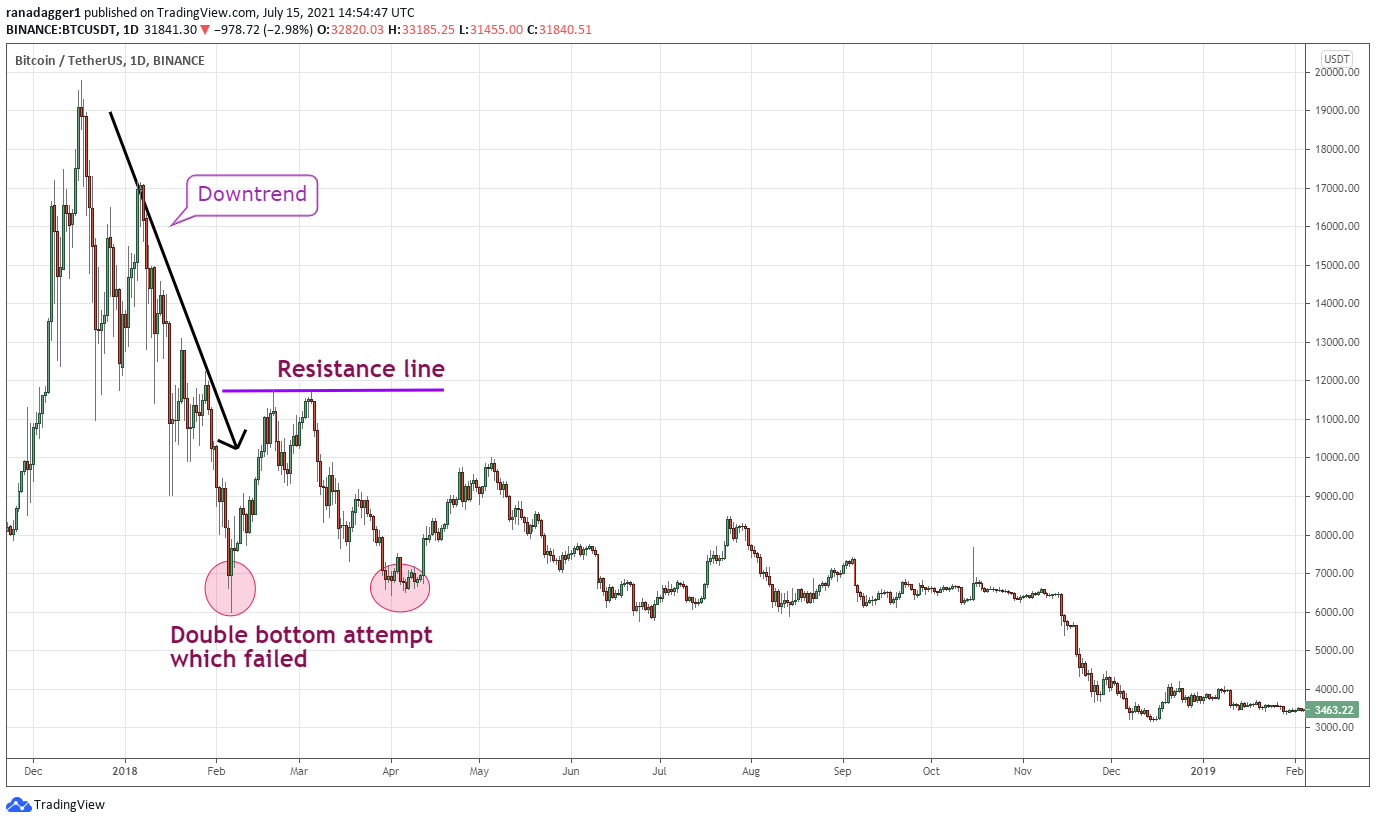
Bitcoin (BTC) has been going down since December 2017, when it hit $19,798.68. Because they didn’t want the price to go down any further, they stopped at $6,000.01 on Feb. 6, 2018. After that, the relief rally reached $11,786.01 on Feb. 20, 2018, and it kept going. On April 1, 2018, the price fell again to $6,430.
This looked like a double bottom, but the bulls couldn’t get the price above $11,786.01 because they didn’t have enough strength. There was no finish to the double bottom pattern, so it didn’t finish.
Trends did not change from down to up even though the $6,000 level held. In the end, the BTC/USDT pair broke through the support level on Nov. 14, 2018, and continued to fall.
The most important things to remember.
It is important to keep these things in mind when you see a double bottom, which means the trend is about to change.
In order for a reversal to happen, the trend must be down before the first bottom is made. If the trend is not down, then there won’t be one. A lot of times, traders should wait for a pattern to finish by breaking out of a resistance line before they buy because the pattern often doesn’t work in a downtrend.
In most cases, when a long-term trend changes direction, it tends to go above and beyond the target of the setup. So, traders can use the target goal as a guide, but they should not be in a hurry to close the position just because of that.
In this post, the author says what he thinks and doesn’t always agree with Cointelegraph.com. Every time you invest or trade, there is a chance you could lose money. You should do your own research before making a decision.


